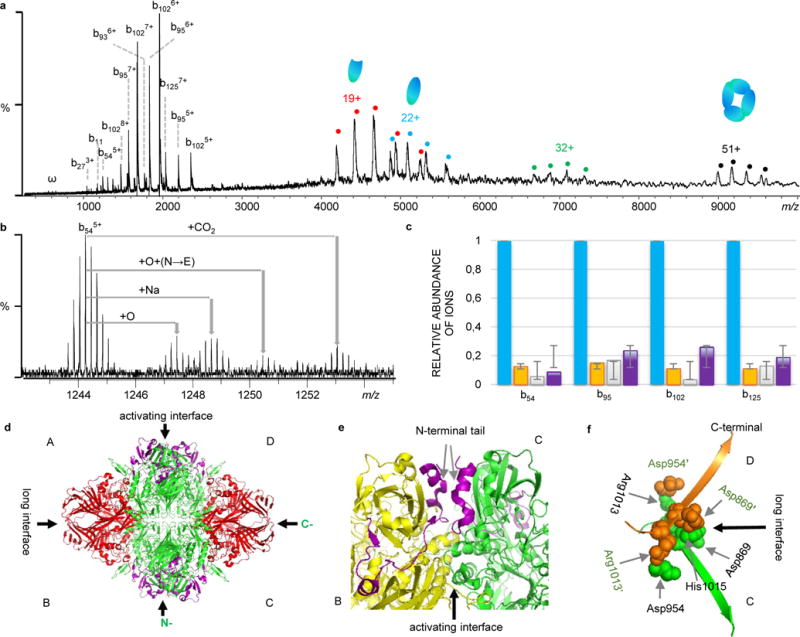
Figure 6.

Native top-down MS analysis of β-galactosidase (β-GTD). a) CAD mass spectrum of β-GTD. b) Observed proteoforms with different PTMs and site mutations. c) Relative ratio of proteoforms based on the intensity of fragment ions (Blue: unmodified; Orange: oxidized (+15.98930); Green: +30.98345; and Purple: +43.9905. d) Structure of β-GTD (PDB 1F4A) with the regions sequenced by IRMPD in red, and CAD in purple. e) The activating interface between chain B (yellow) and chain C (green) with the N-terminal tail highlighted in purple (AA 1-50). f) The long interface between chain C (green) and chain D (orange). The C-terminal residues Asp869, Asp954, Arg1013, and His1015 from C chain interact with residues Asp869′, Asp954′, Arg1013′, and His1015′ from D chain through salt bridges.
