
Figure 3.
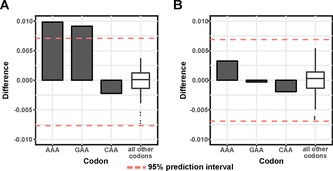
Starvation‐induced codon enrichment among differentially expressed genes. Codon enrichment of AAA, GAA and CAA in comparison with all other codons in A) starved animals, and B) heat‐shocked animals (95 % prediction intervals are marked by dashed lines, difference is calculated by weighing codon abundance to gene expression levels in treated vs. control samples).