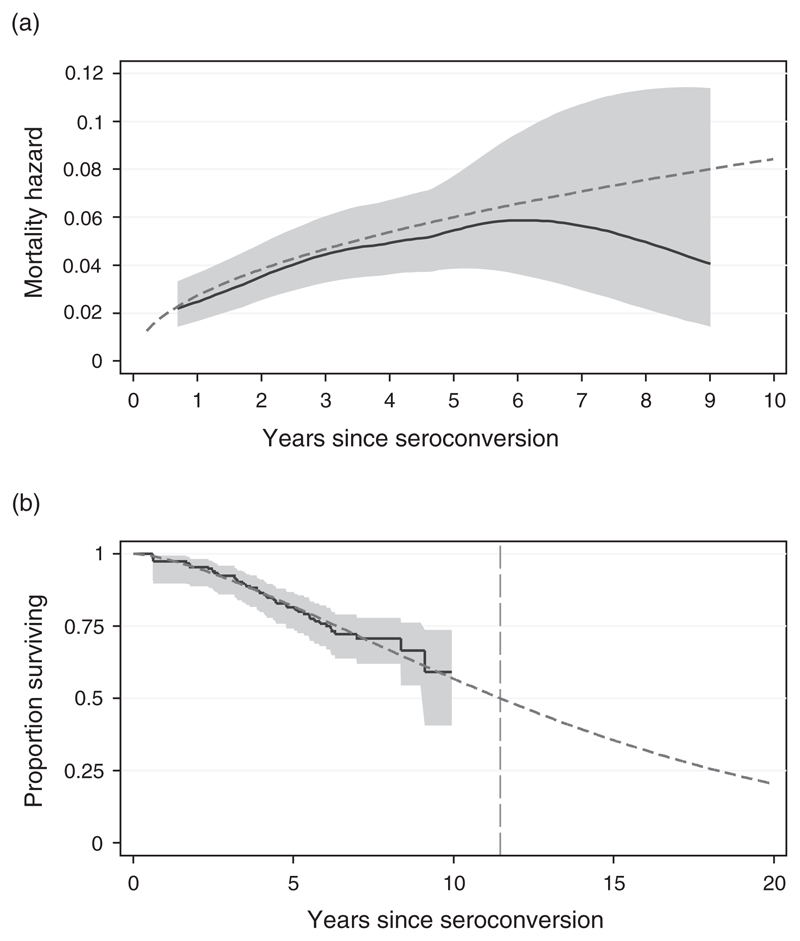
Fig. 1. Comparison of observed and model representation of mortality of seroconverters in Kisesa, 1994–2005.
(a) Mortality hazards.  95% confidence intervals;
  smoothed hazard function;
  Weibull fitted hazard function; (b) Proportion surviving, with out of sample prediction.
  95% confidence intervals;
  survivor function;
  Weibull fitted survivor function.

