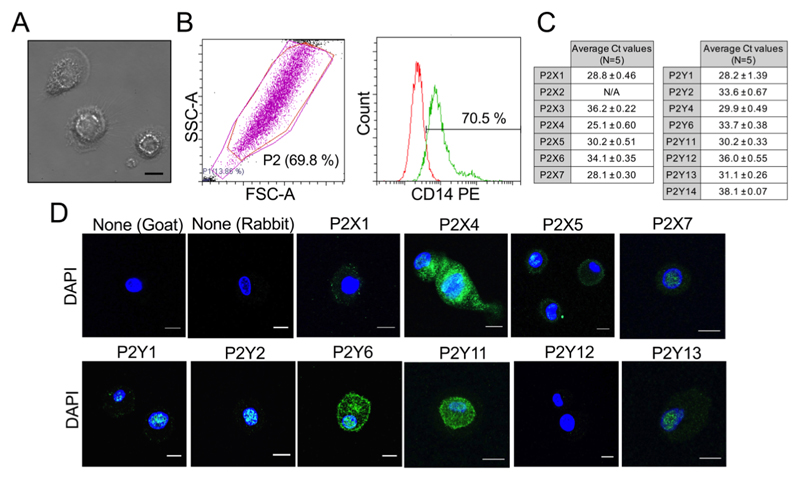
Figure 1. Characterizing GM-MDM cells and purinergic signaling in GM-MDM cells.
A) Bright field image to study morphology of GM-MDM cells resembling classical ‘fried-egg’ characteristics. Scale bar represents 10 μm. B) Flow cytometer analysis: FSC vs. SSC plot with P2 population indicating MDM population (left panel) and histogram to quantify CD14+ GM-MDM cells (Red: IgG Isotype control, Green: CD14-PE; right panel). C) Level of mRNA expression of P2X and P2Y receptor genes as quantified by qRT-PCR (N=5 donors). mRNA transcript found above Ct 35 is considered absent. D) Distribution and expression of intracellular P2X and P2Y receptor proteins in GM-MDM cells as visualized under confocal microscopy. Secondary only control with either goat AF488 or Rabbit AF488 are included on the left. Scale bar represents 10 μm. Images shown in A, B and D are representative of 3 donors.

