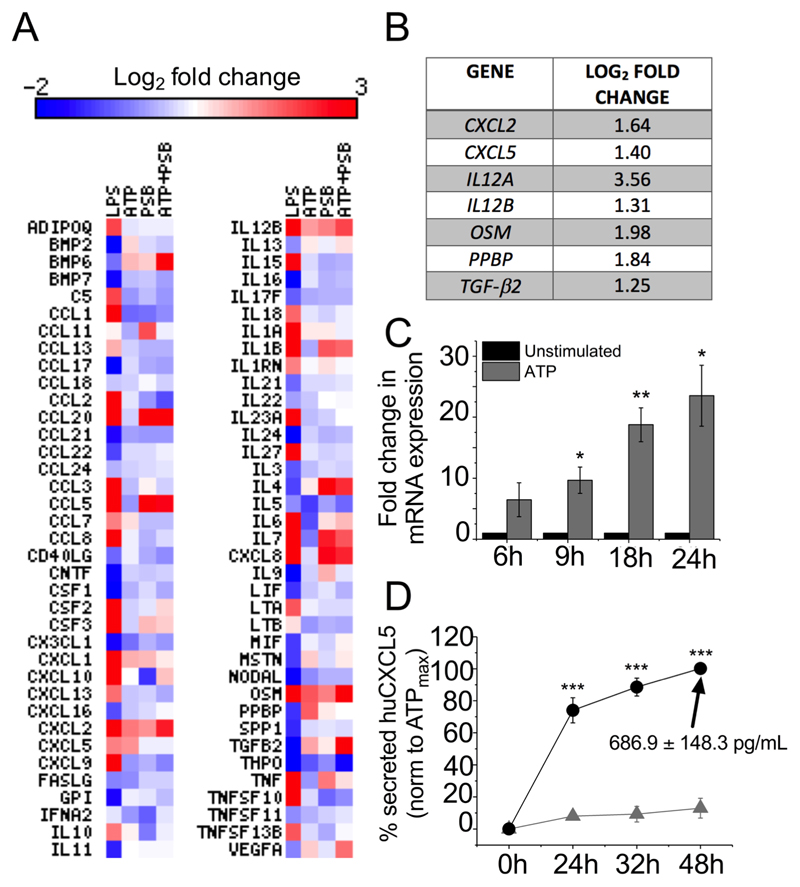
Figure 4. ATP induced the expression of various genes in human monocyte-derived macrophages.
A) Heat map summarizing expression data for 76 genes exhibiting differential expression across various stimulation (LPS, ATP, PSB-12062 and ATP + PSB-12062) at 6h. Expression of genes are presented by intensity of color as log2 fold change and averaged over 3 independent donors for all conditions, except LPS treatment consisting of 1 donor. B) ATP positively induced the expression of 7 genes. Fold change represented as Log2 values (N=3 donors). C) qRT-PCR analysis of effect of blocking P2X4 (10 μM PSB-12062) over different time points (6h, 9h, 18h and 24h) (N=6 donors). D) Time-dependent effect of ATP on CXCL5 protein secretion as quantified using ELISA (N=7-9 donors). The absolute amount of CXCL5 secreted by maximal ATP (ATPmax) at 48h is indicated in black arrow. Statistical significance is represented as * p<0.05 and ** p<0.01.

