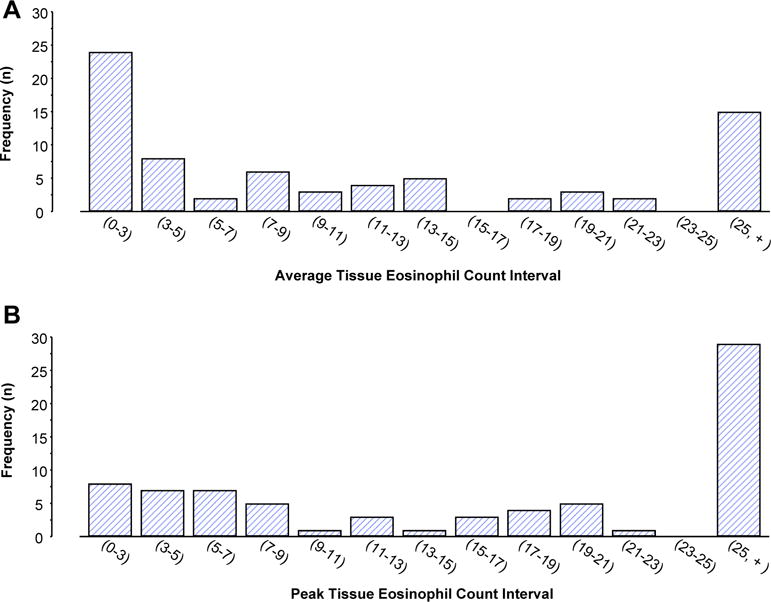
FIGURE 1.

Tissue eosinophil distribution in NP samples. Eosinophils were counted in ten 400× hpfs. Distribution of the cohort as a function of average (A) and peak (B) expression is displayed. For the distribution of eosinophil numbers in Figure 1, A and B, (indicates inclusion of that number and) indicates less than that number.
