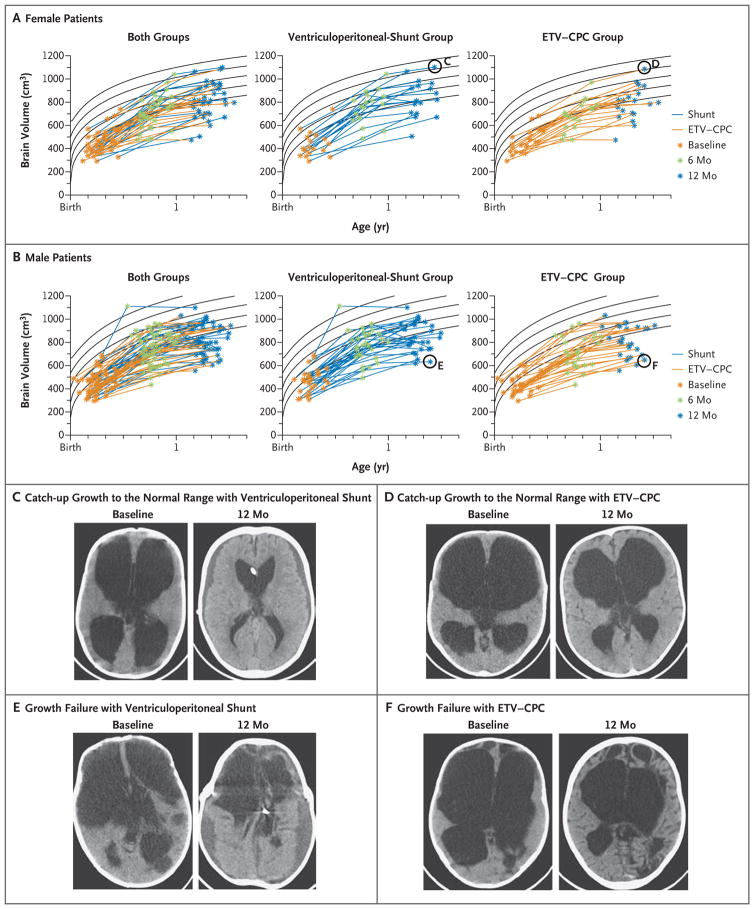
Figure 3. Brain Volume.
Panels A and B show brain-volume trajectories for female and male patients, determined by examination of preoperative, 6-month postoperative, and 12-month postoperative scans. Curve fits (Weibull distribution) to normative data26 are indicated with black lines representing the age-adjusted mean and 1 and 2 SD above and below the mean. The scans represented by the circled data points in Panel A are shown in Panels C and D (for a patient in each treatment group who had catch-up growth to the normal range), and the scans represented by circled data points in Panel B are shown in Panels E and F (for a patient in each treatment group who had growth failure). In Panels C through F, the preoperative (baseline) scan is shown on the left, and the corresponding 12-month postoperative scan is shown on the right.

