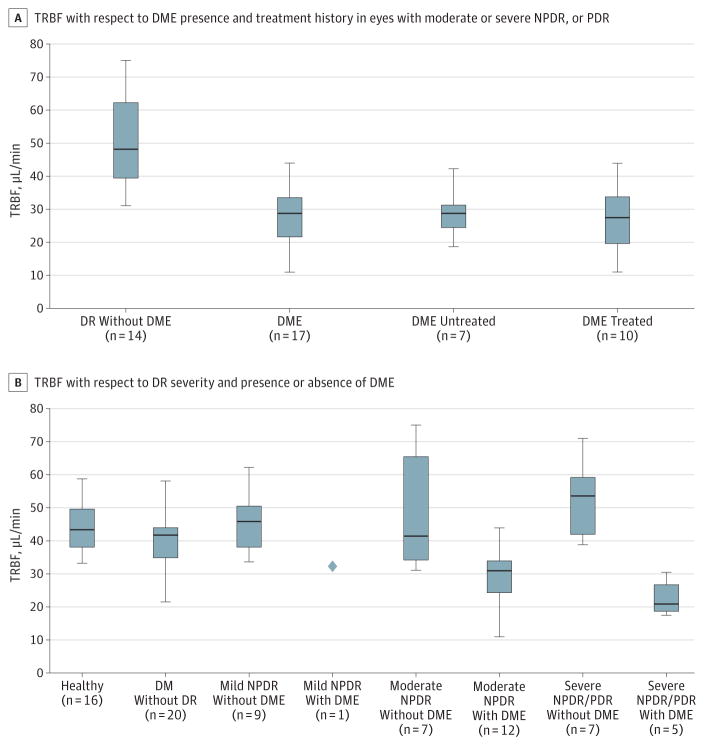
Figure 2. Boxplots of Measurements of Total Retinal Blood Flow (TRBF).
The horizontal line in the middle of each box indicates the median, while the top and bottom borders of the box mark the 75th and 25th percentiles, respectively. The whiskers above and below the box mark the minimum and maximum. DM indicates diabetes mellitus; DME, diabetic macular edema; DR, diabetic retinopathy; NPDR, nonproliferative DR; PDR, proliferative DR.

