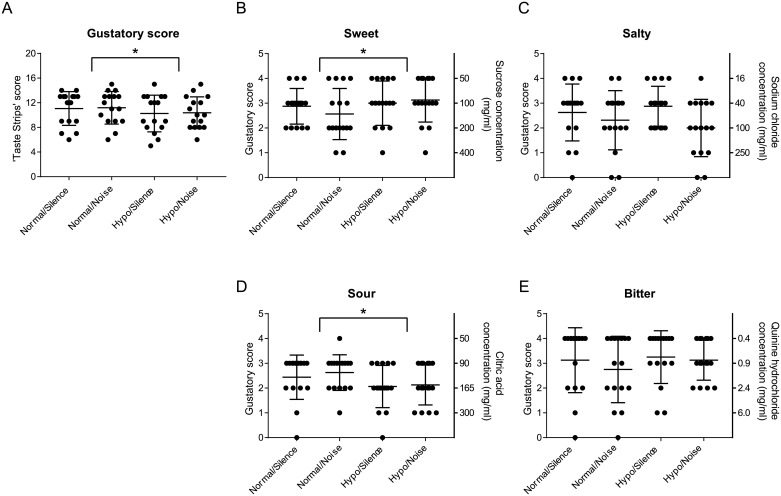
Fig 2. Gustatory score and underlying tastant thresholds for all participants.
(A) Individual and mean (±SD) cumulative function scores based on ‘Taste Strips’ identification. (B–E) The underlying thresholds for the different tastants as well as the corresponding tastant concentration are also shown. * Significant differences at p < 0.05 (ANOVA).

