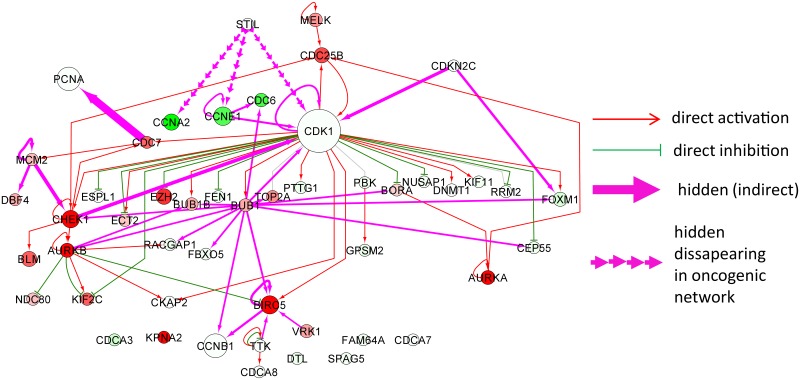
Fig 7. Network of proteins shown to be related to cell proliferation by transcriptomic data analysis.
The meaning of the node and edge colors is the same as in Fig 6 besides those regulations which disappear in “cancer” network compared to “normal” network (shown by interrupted line arrows).

