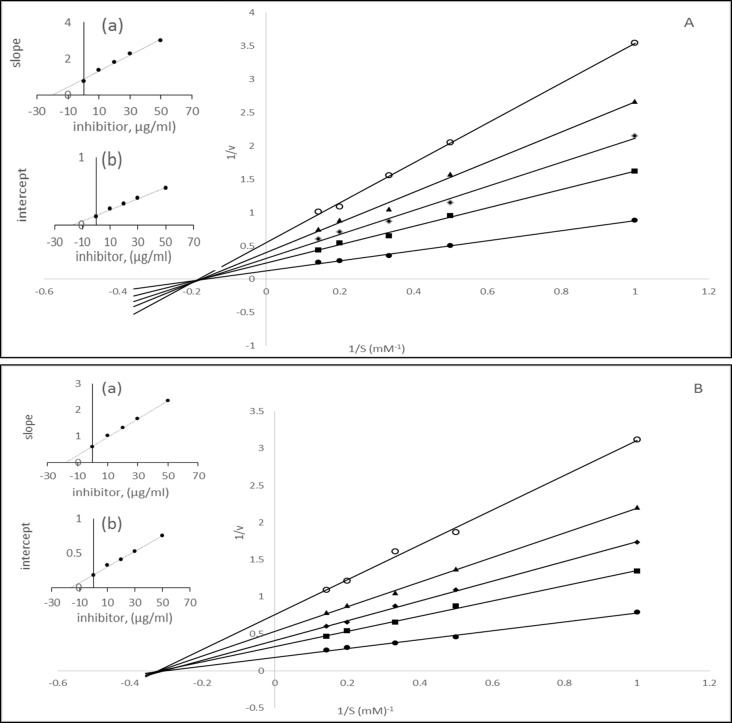
Fig 9. Lineweaver-Burk plot for the activities of aldose reductase in the presence of various concentration of substrates (1–5 mM) and inhibitors.
A) different concentration of phenolic acids, (● 0, ▪ 10, ◊ 20 Δ 30, ○50 μg/ml) B) different concentration of anthocyanins (● 0, ▪ 10, ◊ 20 Δ 30, ○50 μg/ml).

