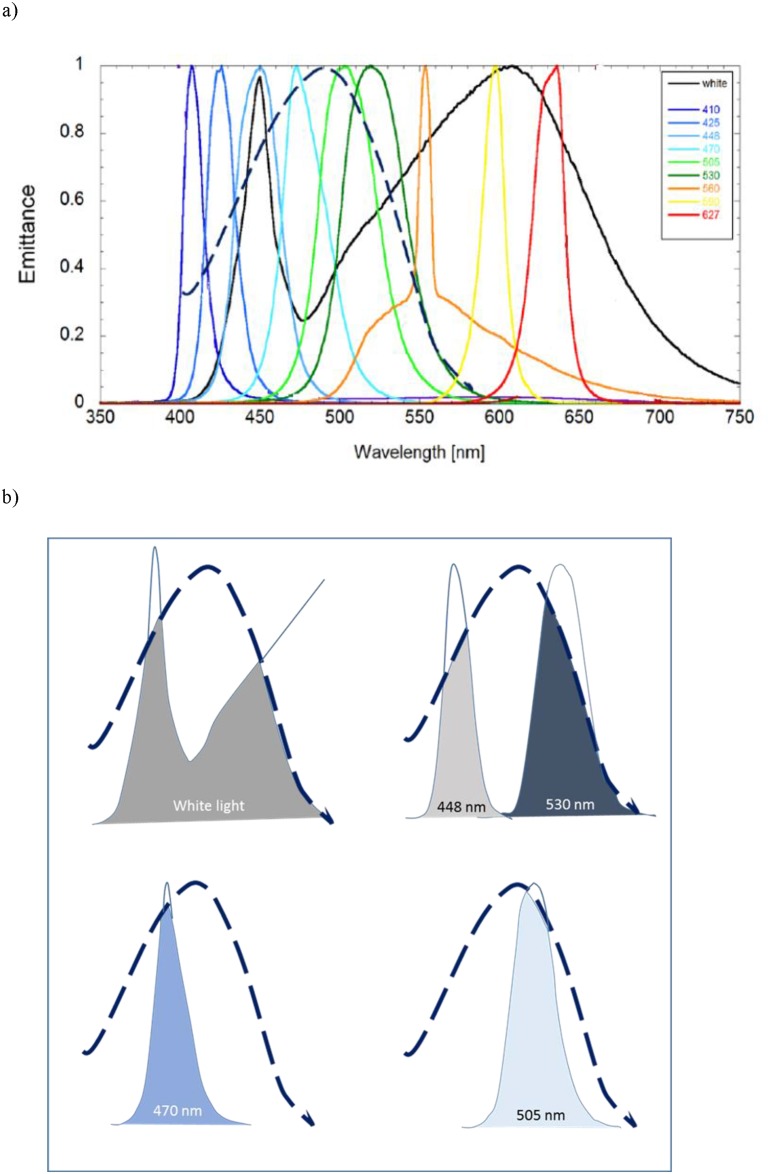
Fig 2. Krill’s visual sensitivity curve compered to intensity curve of tested LED lights.
Spectral intensity curve of the tested LED lights, and how they relate to the visual sensitivity curve of krill (Meganyctiphanes norvegica): A) shows wavelength and emittance spectre provided by the manufacturer (given as emittance normalised to maximum) of the different LED lights tested in the krill study and the spectral sensitivity curve of krill (---- black line) which is redrawn from Frank and Widder (1999, Fig 1). B) The most “attractive” LED lights and their area falling within the sensitivity curve of krill’s visual pigment (---- black line).

