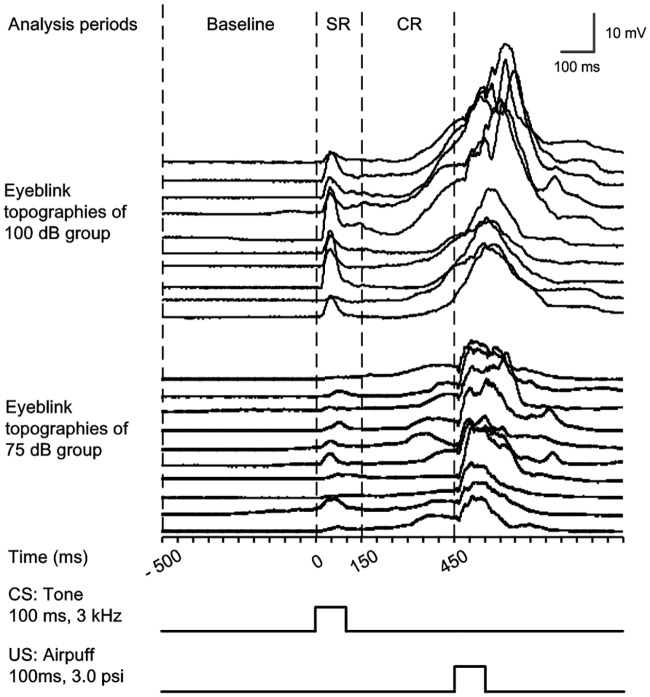
Fig 1. The temporal relationships of the analysis periods during trace eyeblink conditioning.
The eyeblink waterfall plots of 75 dB and 100 dB groups contains ten trials across ten blocks during last acquisition training session of a representative guinea pig of the two groups respectively. In each trial, we analyzed the parameters of the startle eyeblink response (SR; analysis period within 0–150 ms after the CS onset) and conditioned eyeblink response (CR; analysis period within 150–450 ms after the CS onset). These responses were based on the average amplitude of the baseline within 0–500 ms period prior to the onset of the CS.

