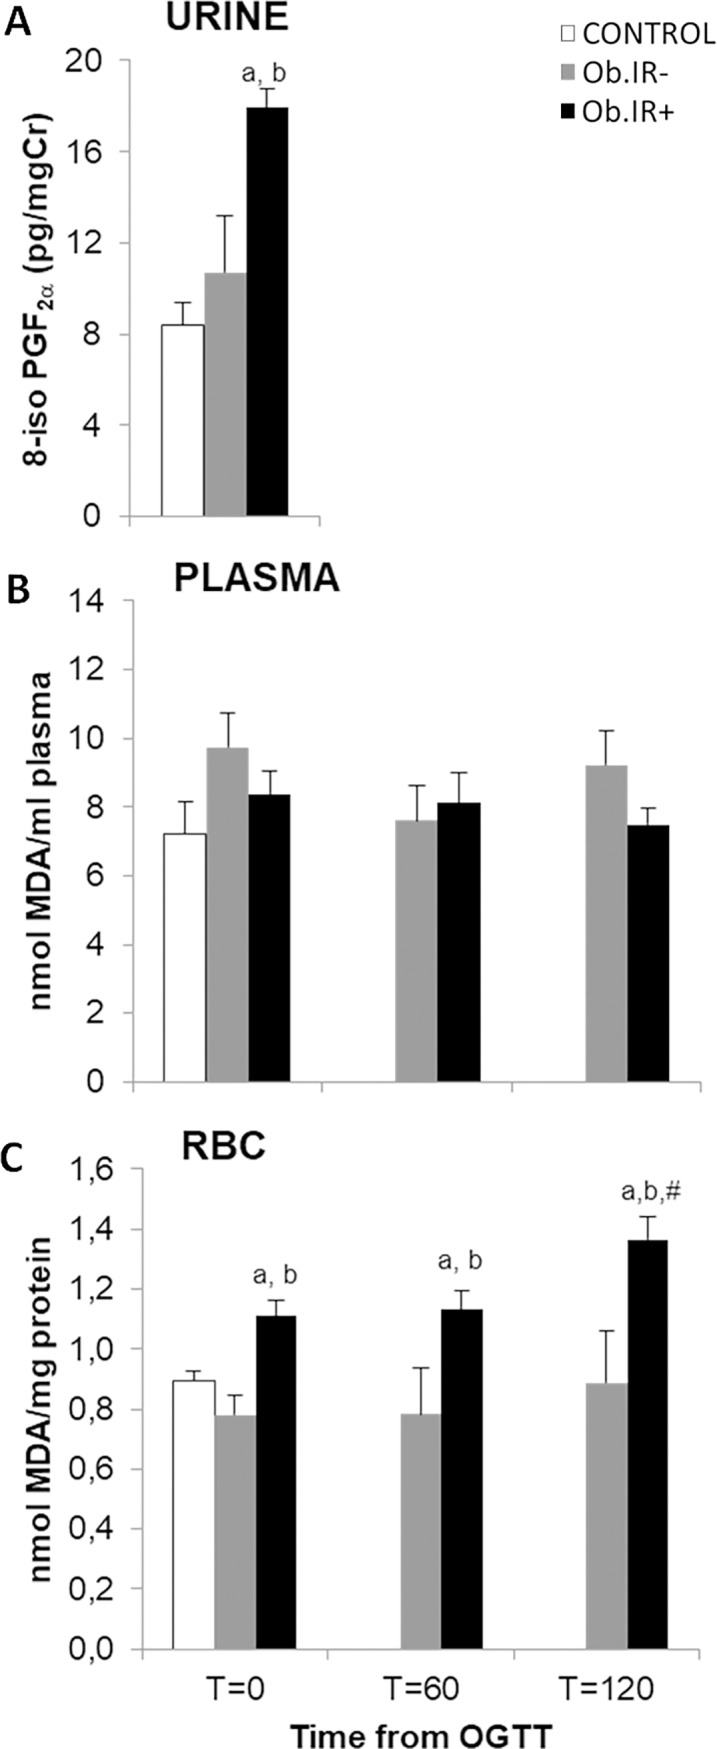
Fig 1. Lipoperoxide levels in urine, plasma and RBC of healthy and obese children.

(A) Basal levels of urinary 8-isoprostane (8-iso PGF2α), (B) Plasmatic levels of TBARS at baseline and along 75 g. OGTT, and (C) RBC concentration of TBARS at baseline and along 75 g. OGTT. White bars represent the control group, grey bars represent Ob.IR- group, and black bars represent Ob.IR+ group. Data are represented as mean ± SEM. P<0.05 was considered for statistical significance. (a) show significant differences relative to control at baseline, (b) shows significant differences relative to Ob.IR-, and (#) intragroup differences along the OGTT respect to baseline values.
