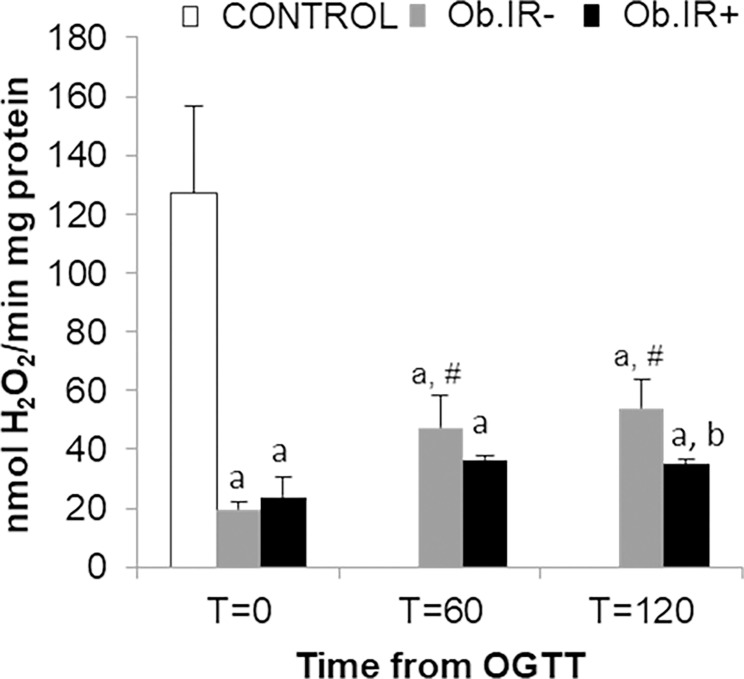
Fig 4. Catalase activity in RBC of healthy and obese children.
At baseline and along the OGTT. Data is expressed in nmol H2O2 x min-1 x mg-1 of protein. White bars represent the control group, grey bars represent Ob.IR- group, and black bars represent Ob.IR+ group. Data are represented as mean ± SEM. P<0.05 was considered for statistical significance. (a) show significant differences relative to control at baseline, (b) shows significant differences relative to Ob.IR-, and (#) intragroup differences along the OGTT compared to baseline values.

