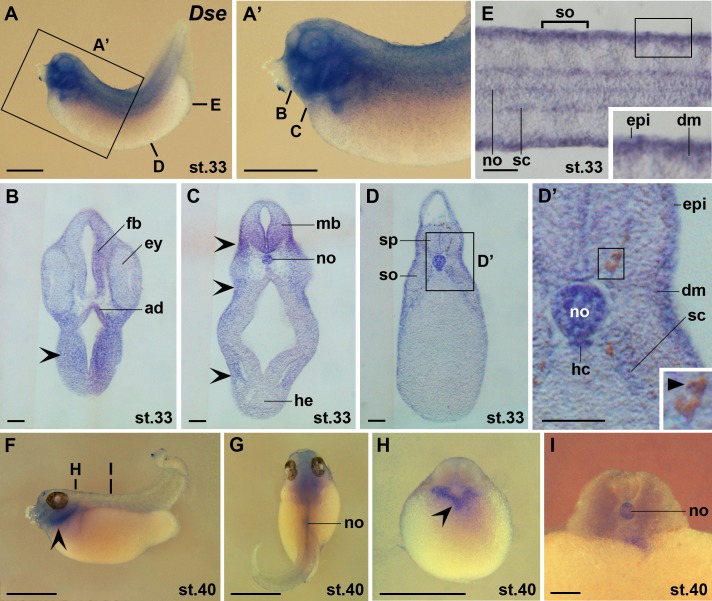
Fig 5. Dse is expressed in the adenohypophysis, melanophores, dermomyotome and sclerotome.
Embryos are shown in lateral view (A,A’,F), dorsal view (G), transversal sections (B-D’,H,I) and horizontal section (E). (A,A’) Embryo at stage 33. The bold lines indicate the level of sections in B-E. (B-E) Vibratome sections showing Dse expression in the adenohypophysis, forebrain, ventral midbrain, epidermis, notochord, hypochord, dermomyotome, and sclerotome. Note also Dse transcripts in cranial neural crest cells (indented arrowheads) and melanophores (filled arrowhead). (F-I) Embryo at stage 40. The bold lines indicate the level of sections in H and I. Dse is expressed in post-migratory cranial neural crest cells (indented arrowheads) and the notochord. ad, adenohypophysis; dm, dermomyotome; epi, epidermis; ey, eye; fb, forebrain; hc, hypochord; he, heart; mb, midbrain; no, notochord; sc, sclerotome; so, somite; sp, spinal cord. Scale bars are 1 mm (A,A’,F-H) and 100 μm (B-E,I).

