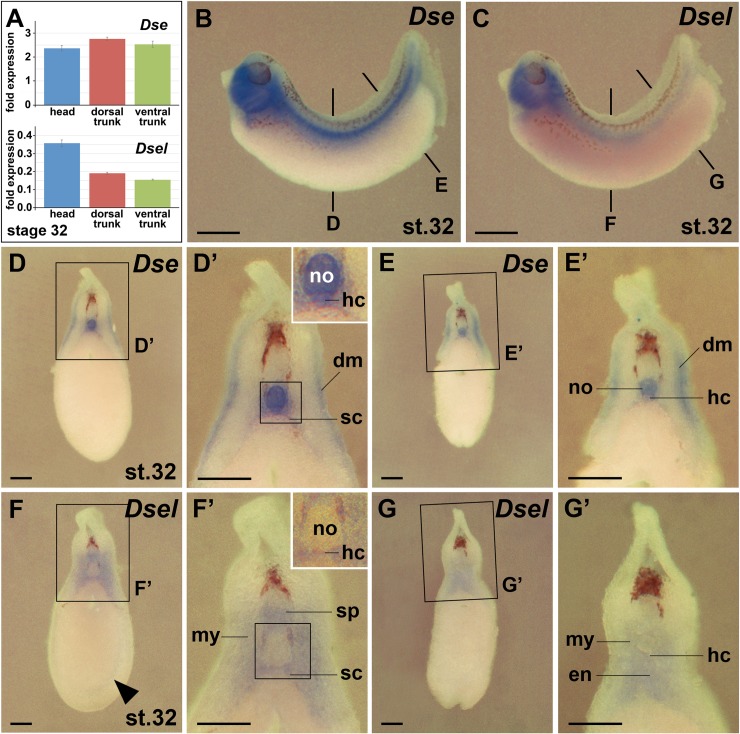
Fig 10. Comparison of Dse and Dsel expression in the trunk.
Embryos at stage 32 are shown in lateral views (B,C) and transversal sections (D-G’) after whole-mount in situ hybridization. (A) qPCR analysis of embryonic explants at stage 32. The numbers on the y-axis indicate fold expression of (Dse / eEF1A1) x 1000 (top) and (Dsel / eEF1A1) x 1000 (bottom). Note equal distribution of Dse transcripts in the head, dorsal trunk and ventral trunk. Dsel mRNA is most abundant in the head and is expressed at comparable levels in the dorsal and ventral trunk. (B) Dse expression. The bold lines indicate the level of sections in D and E. (D-E’) Dse expression is detected in the notochord, dermatome, sclerotome and hypochord (inset). (C) Dsel expression. The bold lines indicate the level of sections in F and G. (F-G’) Dsel expression appears in the ventral spinal cord, migrating trunk neural crest cells (arrowhead), myotome, sclerotome, hypochord (inset) and posterior dorsal hindgut endoderm. dm, dermatome; en, endoderm; hc, hypochord; my, myotome; no, notochord; sc, sclerotome; sp, spinal cord. Scale bars are 1 mm (B,C) and 200 μm (D-G’).

