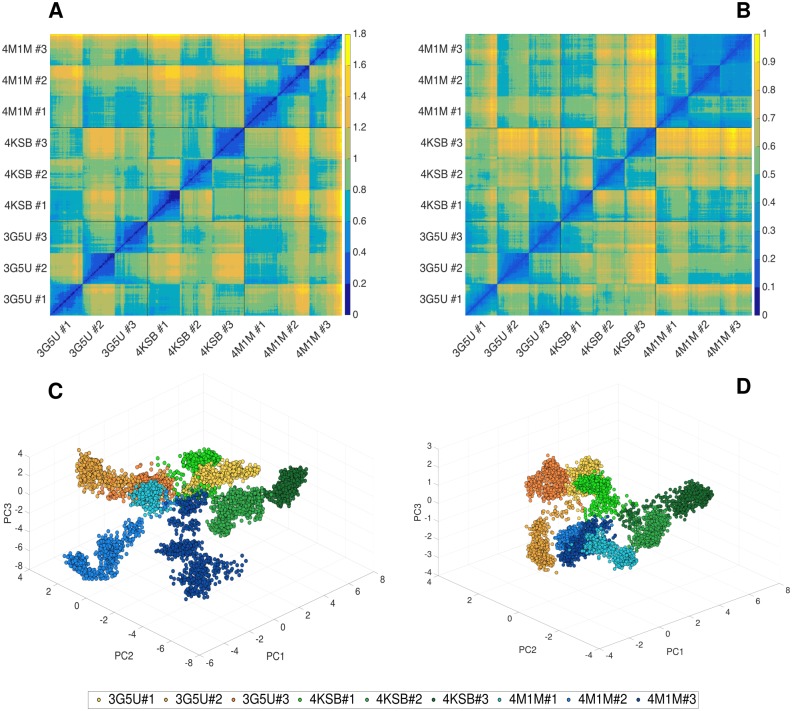
Fig 2. Pairwise RMSD and principal component analysis (PCA).
Heatmap representing pairwise RMSD [nm] calculated for the backbone atoms of P-gp conformations sampled in all 9 trajectories started from 3G5U, 4KSB and 4M1M for (A) the entire protein and (B) the TMD coordinate subset only. Black gridlines separate the three systems, while each replica (3G5U#1-3, 4KSB#1-3, 4M1M#1-3) is visible as a square formation around diagonal line (diagonal corresponds to the RMSD of a structure to itself, which is 0 nm). Conformational space sampled in each simulation as a function of the first three principal components (PC1, PC2, PC3) obtained from the analysis of the concatenated 9 trajectories for (C) the entire protein and (D) the TMD only, respectively. Each replica is shown in a different shade of yellow (3G5U), green (4KSB) or blue (4M1M). The TMD residues used in the pairwise RMSD and PC analysis were Tyr41-Ala358 (TMD1) and Leu684-Phe990 (TMD2).

