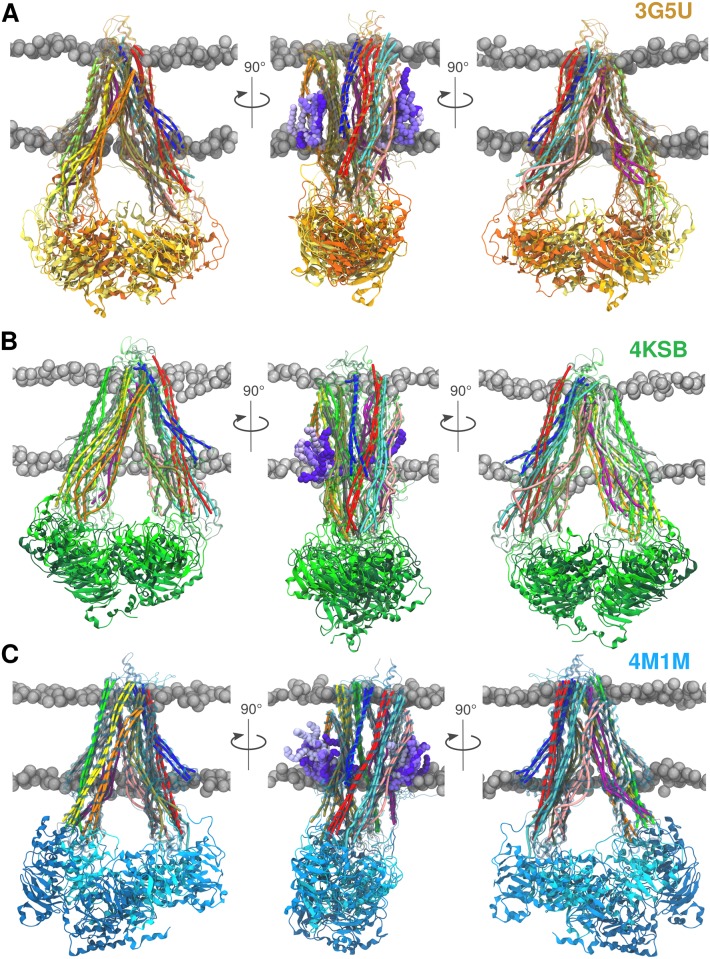
Fig 3. Final snapshots.
Overlap of the final P-gp conformations after 200 ns obtained from three replicas performed for each system. Each replica is coloured in a different shade of yellow for 3G5U (A), green for 4KSB (B), and blue for the 4M1M (C) system, where the lightest shade corresponds to replica #1 and the darkest to replica #3. The left and right panels show the TMD1 and the TMD2 at the front, respectively. The middle panel gives the side-view with lipids interacting with the TM4/6 (left side) and the TM10/12 (right side) portal. The POPC molecules are shown in different shades of violet and again, the lightest shade corresponds to replica #1. The protein is shown in cartoon representation and the TM helices are represented as cylinders that follow the helix axis (bendices) to highlight the change in helical geometry [55]. The POPC/cholesterol bilayer is depicted using the VDW sphere representation of phosphate atoms (grey).

