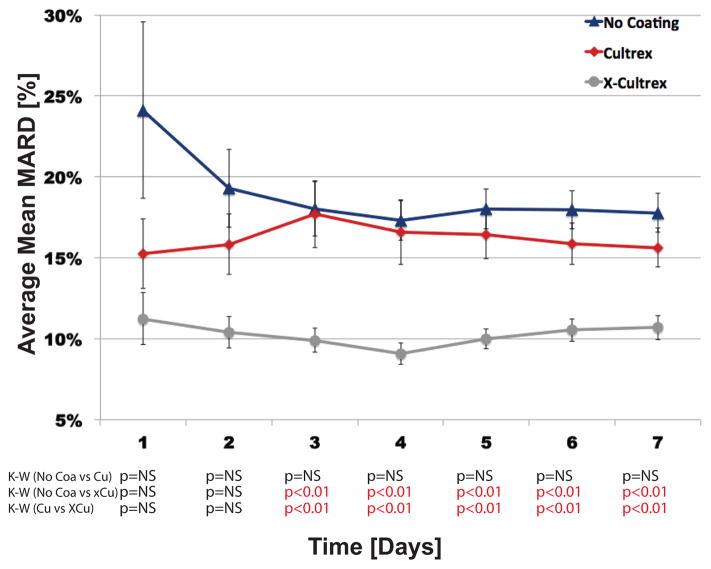
Figure 3. Trend Analysis of First Week Sensor MARDs, Between Sensors Coated with Non-Cross-linked Cultrex, Cross-linked Cultrex or Uncoated (Control) Sensors in CD-1 Mice.
Figure 3 represents the impact of Cultrex and X-Cultrex coating on in vivo trends of continuous glucose monitoring (CGM), by average mean absolute relative difference (MARD) in the first week, separated by day. Cultrex, X-Cultrex coated sensors were compared with uncoated sensors implanted subcutaneously in CD-1 genetic background mice over a four (4) week time period, but the analysis and calculations for this figure were limited to the first week, separated by day. The p-values at the bottom represents the significance of the difference among the three treatment groups in average mean MARD value for each individual week, by Kruskal-Wallis (K-W) tests, as the non-parametric equivalent to ANOVA (Analysis of Variance). The daily MARD values, particularly in days 2 to 7, are cumulative MARD values, meaning the calculated average MARD values for days 2 to 7 represents the average of MARD values for all days prior to, and including, that point, i.e. a cumulative average of all MARD values up to that day, not simply the MARD values in that specific day. The error bars around each data point represents the standard error (S.E.) of the mean MARD for the particular time point and treatment group. Thus MARD values used in these studies are derived from raw sensor output.

