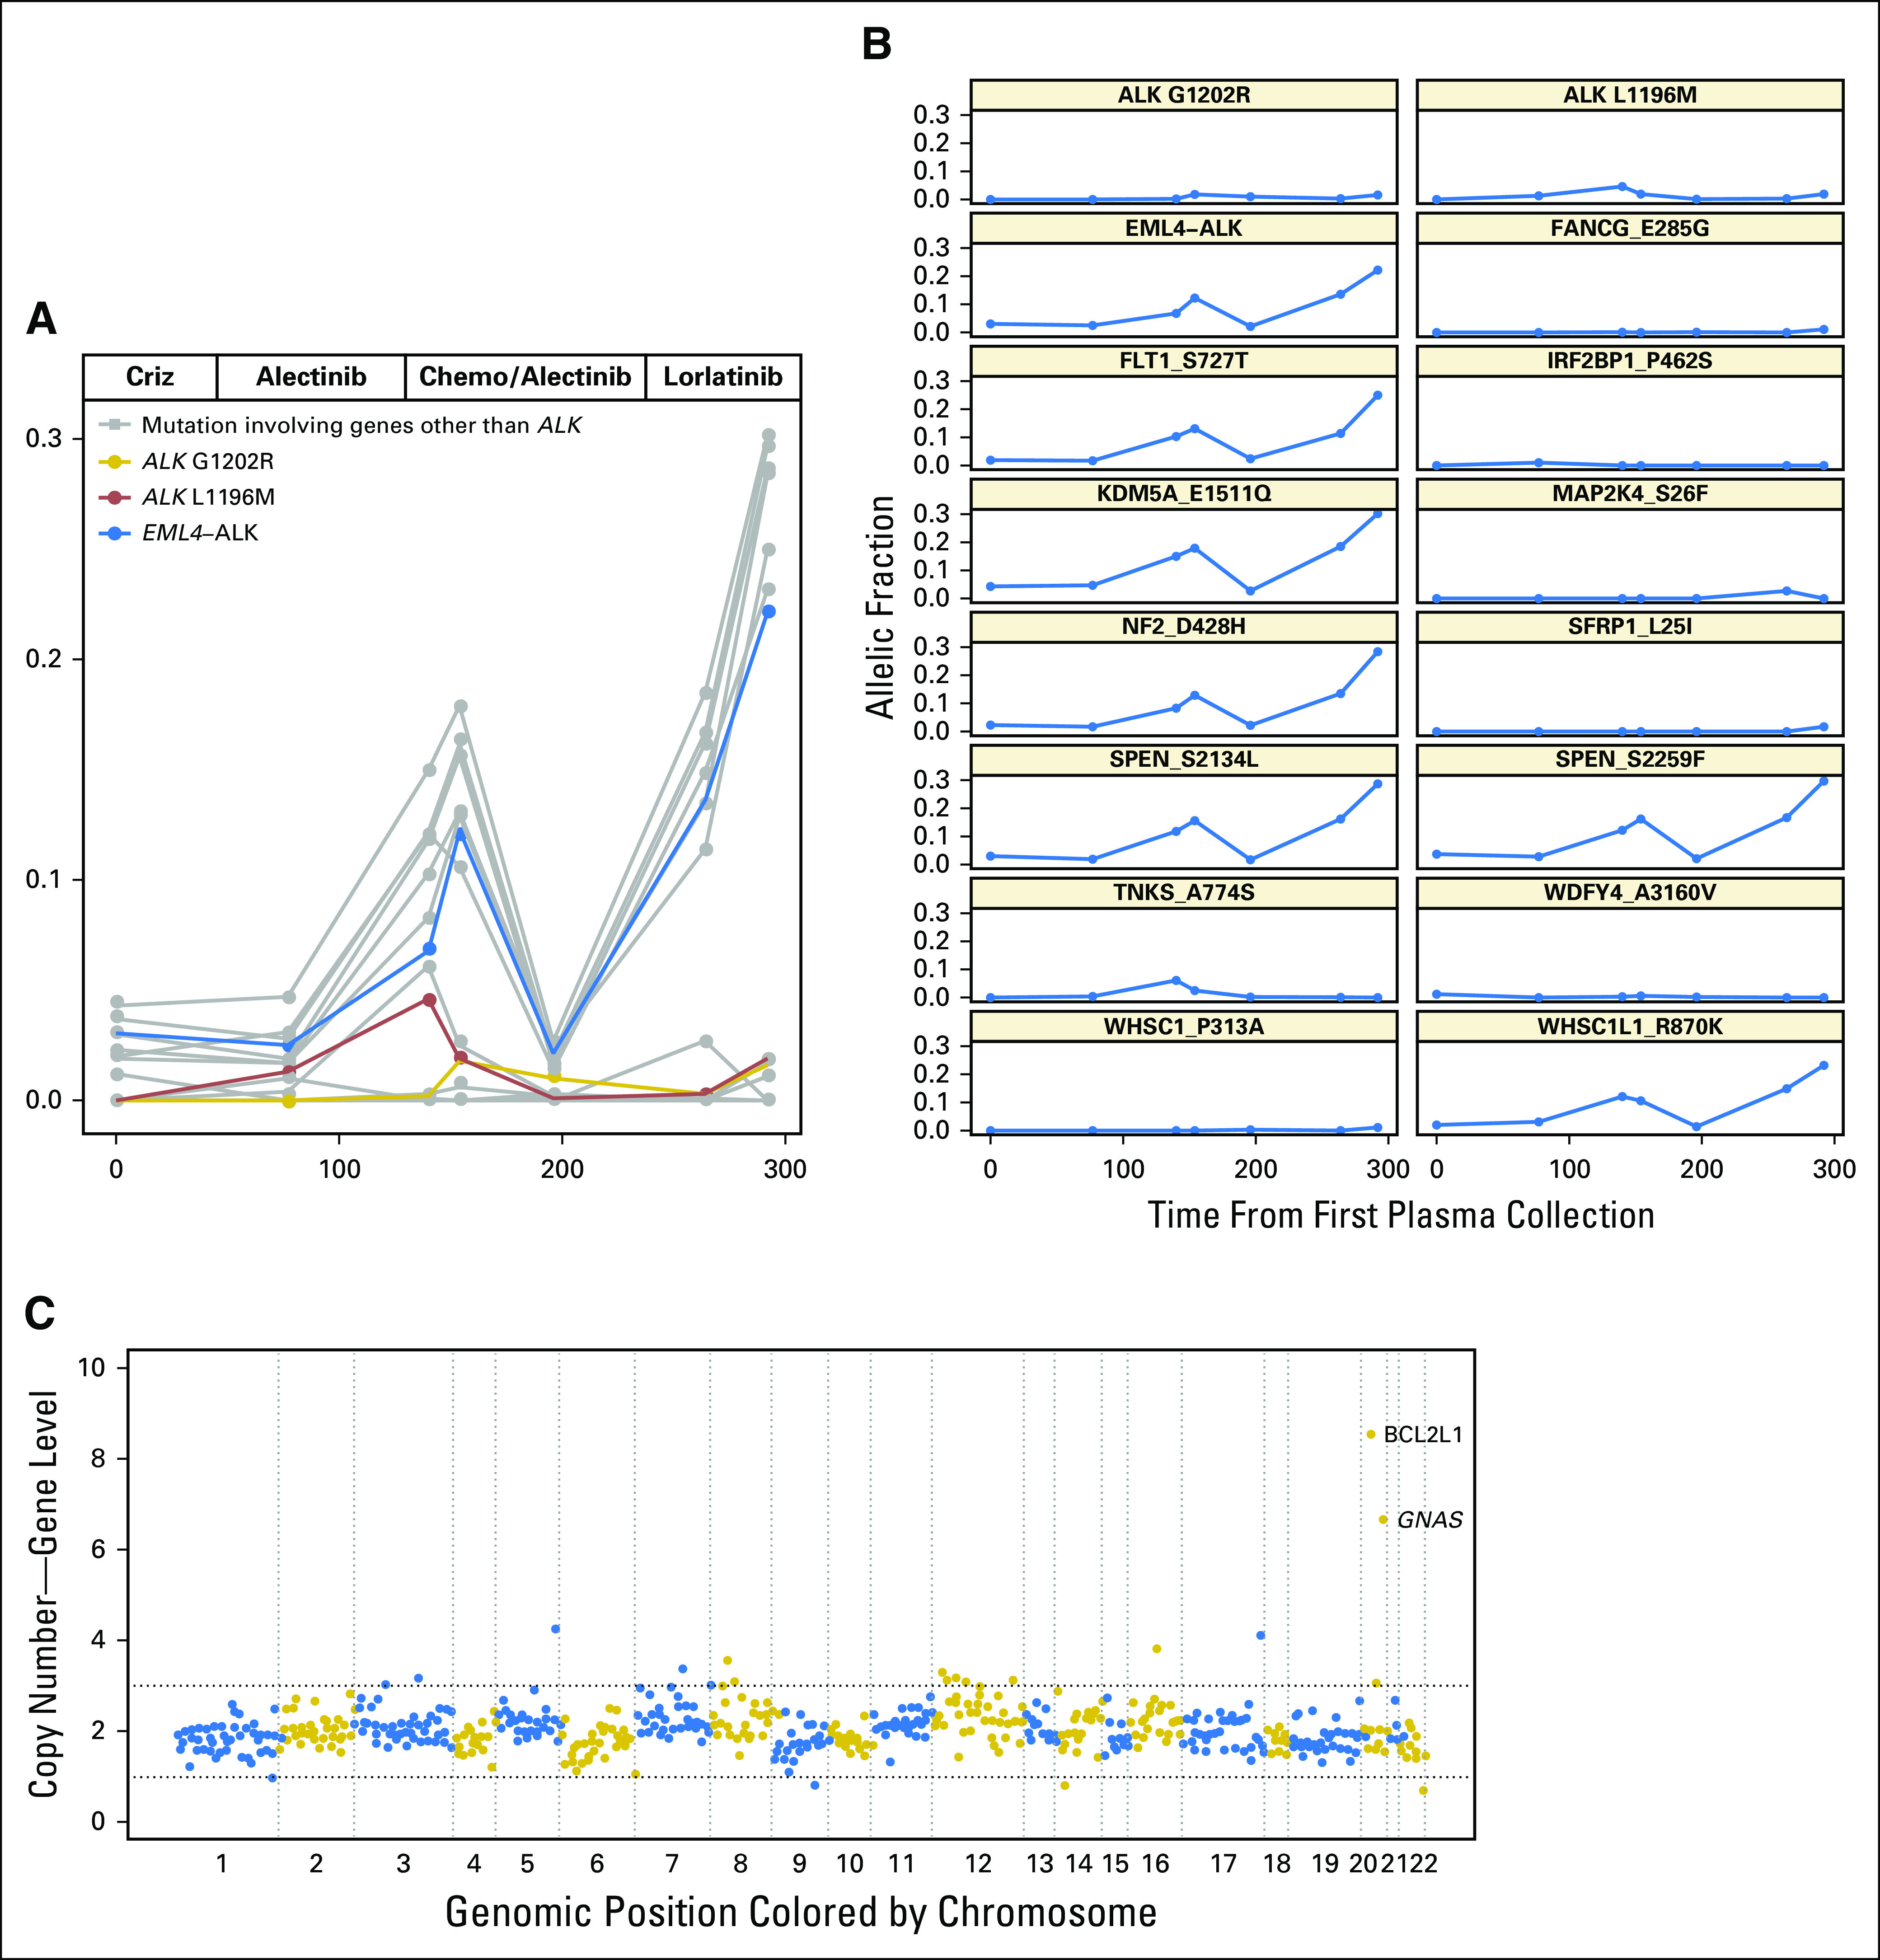
Fig 5.

Longitudinal analysis of the plasma of MGH919. (A) Allelic fraction of ALK (anaplastic lymphoma kinase) fusion (blue), ALK mutations (red and gold), and non-ALK alterations (gray) during treatment with sequential ALK inhibitors. The x-axis represents days from initial plasma collection, whereas the y-axis represents allelic fraction. (B) Individual mutation kinetics during treatment. (C) Plasma copy number plot from a specimen collected during treatment with lorlatinib shows focal amplification of GNAS and BCL2L1. ALK L1196M and G1202R mutations were in trans. Chemo, chemotherapy; Criz, crizotinib.
