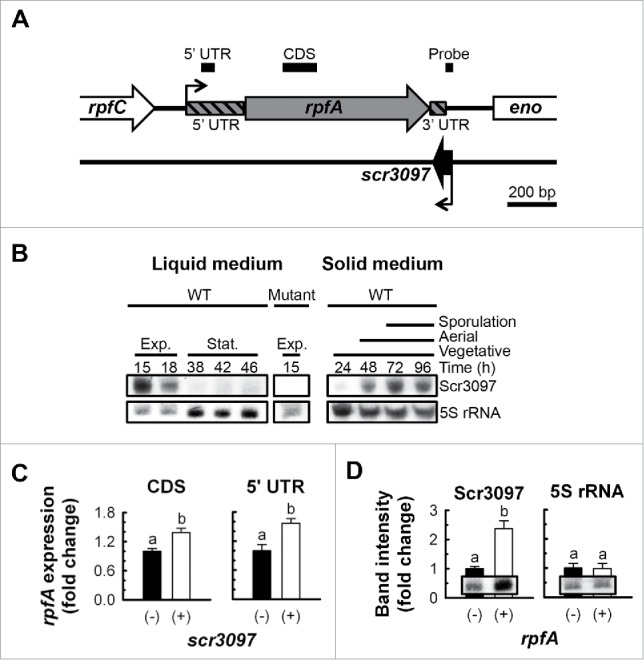
Figure 6.

The antisense sRNA Scr3097. (A) Genetic context of scr3097 in S. coelicolor. Black elbow arrows denote the transcriptional start sites of rpfA and scr3097 as predicted using 5′ rapid amplification of cDNA ends9 and RNA-seq,25 respectively. Location of amplified PCR products (see panel C) and northern probes (see panel D) are shown as bold black lines above the block arrows. Genes, PCR products and northern probes were drawn to scale. (B) The wild-type S. coelicolor strain (WT, M145) and the rpfA-scr3097 deletion mutant (Mutant, E120/pIJ82; control) were grown at 30°C in a liquid rich medium or on a sporulation-conducive solid medium (MS agar). At the times indicated, total RNA was extracted from cells, and Scr3097 and 5S rRNA (control) transcripts were detected using northern blotting. Images are representative of 3 biological replicates. Exp., exponential phase; Stat., stationary phase. (C) scr3097− (E120/pMC241) and scr3097+ (E120/pMC243) strains of S. coelicolor were grown at 30°C in a rich liquid medium. Total RNA was extracted from exponential-phase cells, and rpfA transcripts were quantified by RT-qPCR using primer pairs targeting the coding sequence (CDS) or the 5′ UTR. Transcript levels were normalized to rpoB transcript levels and expressed as fold changes relative to normalized expression levels in scr3097− cells. Data are presented as mean ± standard error (n = 3). Group means annotated with different letters are significantly different. CDS: t(4) = −3.60, p = 0.023; UTR: t(4) = −3.56, p = 0.024. (D) rpfA− (E120/pMC242) and rpfA+ (E120/pMC243) strains were grown at 30°C in a rich liquid medium. Total RNA was extracted from exponential-phase cells, and Scr3097 and 5S rRNA (control) transcripts were detected using northern blotting. Transcripts were quantified using densitometry, and abundance was expressed relative to transcript levels in rpfA− cells. Data are presented as mean ± standard error (n = 3). Group means annotated with different letters are significantly different. Scr3097: t(4) = −2.84, p = 0.047; 5S rRNA: t(4) = 0.08, p = 0.941. Blot images are representative of 3 biological replicates.
