Figure 4.

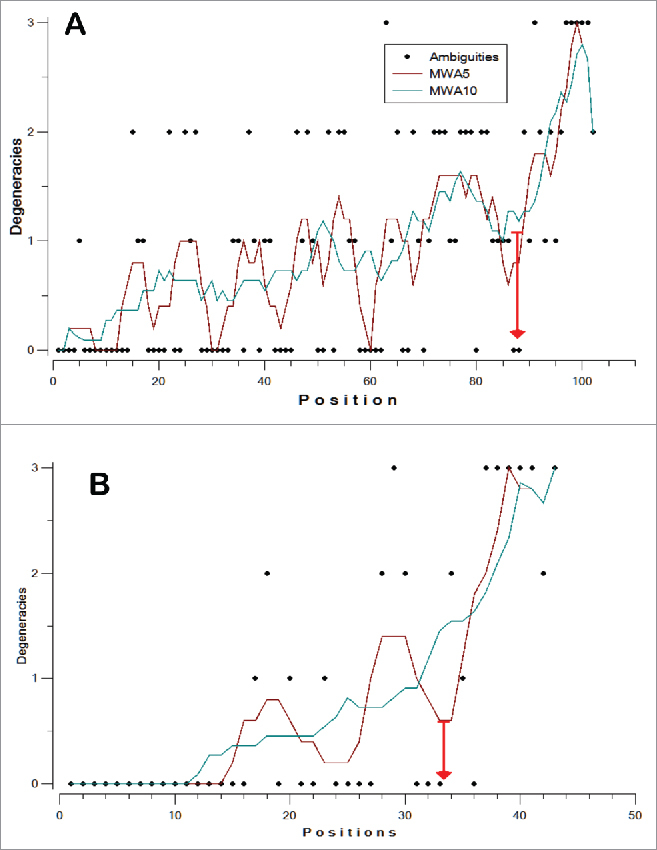
Mobile windows average for the number of degeneracies per position in the 5′ (A) and 3′ (B) ends of the region containing the V3 fragment. The inflection point is indicated by a red arrow, and the numbering is from the corresponding end.

Mobile windows average for the number of degeneracies per position in the 5′ (A) and 3′ (B) ends of the region containing the V3 fragment. The inflection point is indicated by a red arrow, and the numbering is from the corresponding end.