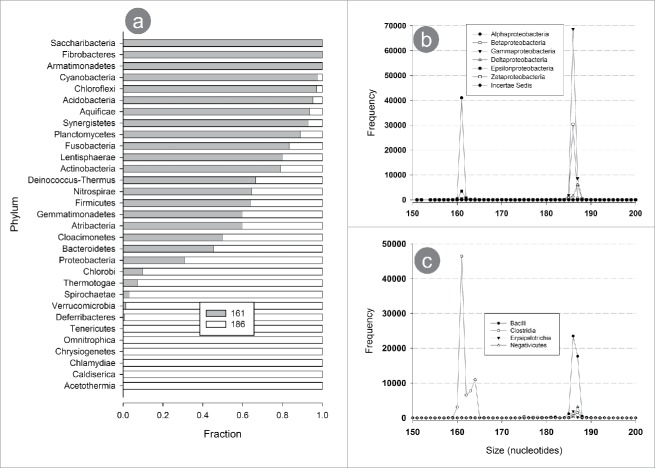
Figure 7.
Size distribution of V3 fragments among bacterial taxonomic phyla. (a) Proportion of fragments measuring 161 and 186 nt in each of the bacterial phylum, in order of the relative abundance (descending) of the 161 nt fragment. The distribution of sizes for the classes of the phyla Proteobactyeria (b) and Firmicutes (c) shows that each class is associated with a particular fragment size.

