
Figure 4.
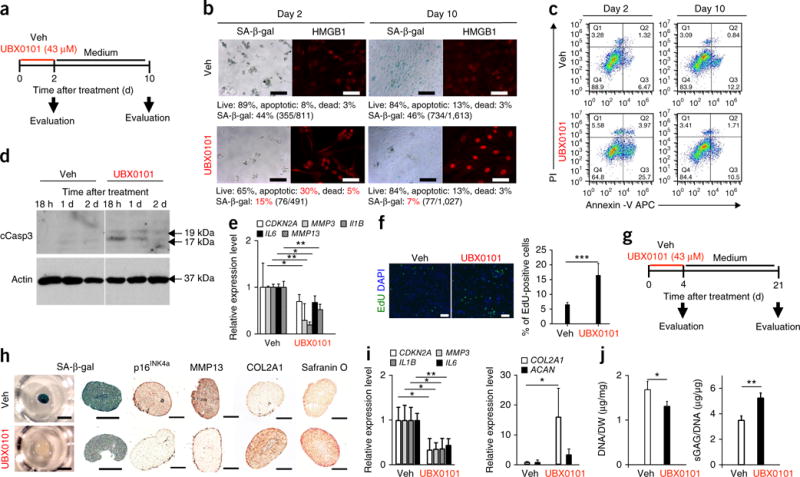
UBX0101 clears SnCs by inducing apoptosis and improves the cartilage-forming ability of chondrocytes from human OA tissue. (a) Schematic of the monolayer experiments in b–e. (b) Quantification of SA-β-gal-positive cells and the percentage of live (gate Q2, PI−Annexin V−), apoptotic (gate Q3, PI−Annexin V+ and gate Q4, PI+Annexin V+), and dead (gate Q1, PI+Annexin V−) SnCs in monolayer-cultured human OA chondrocytes treated with vehicle or 43 μM UBX0101. Representative images are shown of cells with nuclear HMGB1 (red) visualized by immunostaining (n = 10 images per group). Scale bars, 100 μm. (c) Representative flow cytometric plots measuring apoptosis from three independent experiments. (d) Immunoblot analysis of cleaved caspase-3 (cCasp3) and actin in human OA chondrocytes at 18 h, 1 d and 2 d after incubation with vehicle or 43 μM UBX0101. The experiment was performed two independent times. See Supplementary Figure 13 for uncropped immunoblots. (e) Quantification of mRNA levels for CDKN2A, MMP3, IL1B, IL6 and MMP13 normalized to ACTB levels; n = 3 for each group. (f) Representative EdU staining (left; green) and quantification of the percentage of EdU-positive cells remaining (right) in human OA chondrocyte cultures after removing SnCs using UBX0101; n = 5 for each group. Scale bars, 100 μm. (g) Schematic of the 3D pellet culture experiments in h–j. (h) SA-β-gal staining (left; scale bars, 1 mm) and sectioned images immunostained for p16INK4a, MMP13 and COL2A1 and stained for safranin O (right; scale bars, 100 μm) in 3D pellet cultures of human OA chondrocytes treated with vehicle or 43 μM UBX0101; n = 3 for each group. (i) Quantification of mRNA levels for CDKN2A, MMP3, IL1B, IL6, COL2A1 and ACAN normalized to ACTB levels; n = 3 for each group. (j) DNA content normalized to dry weight (DW) and sGAGs normalized to DNA content; n = 3 for each group. In e, f, i and j, data are shown as averages ± s.d. Statistical analysis was performed using two-tailed t-tests (unpaired). *P < 0.05, **P < 0.01, ***P < 0.001.