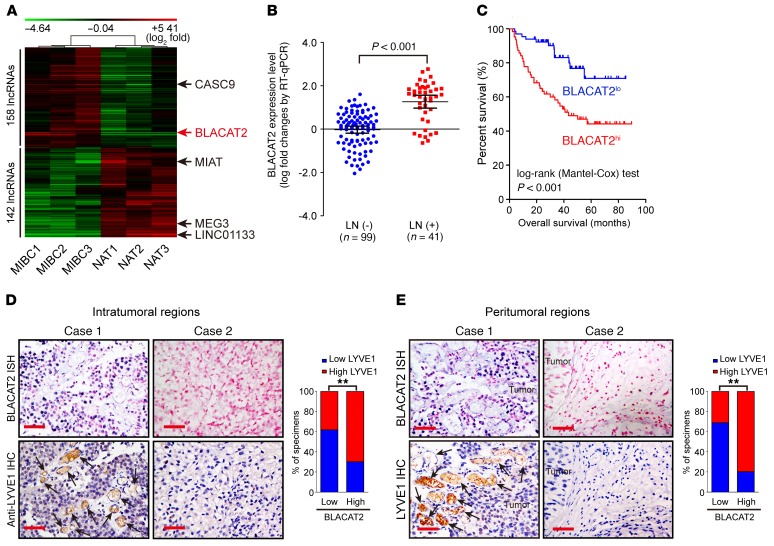
Figure 1. BLACAT2 overexpression correlates with LN metastasis and poor prognosis of bladder cancer.
(A) Unsupervised hierarchical clustering of lncRNAs that are differentially expressed in MIBC and paired normal adjacent tissues (NAT) (fold changes > 2.0, P < 0.05). The red color scale (log2 fold change) represents a higher expression level, and the green color scale represents a lower expression level. (B) RT-qPCR analysis of BLACAT2 expression in a 140-case cohort of freshly collected human bladder cancer samples with or without LN metastasis. The nonparametric Mann-Whitney U test was used to compare the expression levels of the 2 groups. (C) Negative correlation between BLACAT2 expression and survival in the patient cohort referred to in B. The Kaplan-Meier method was used to estimate survival for the 2 groups. Median BLACAT2 expression was used as a cutoff value. (D and E) Representative images (left panels) and percentages (right panels) of tissue specimens with high and low levels of LYVE1-positive intratumoral (D) and peritumoral (E) microlymphatic vessels in 140 cases of bladder cancer with low or high expression of BLACAT2. BLACAT2 expression levels were quantified by ISH, and microlymphatic vessel density was quantified by immunohistochemistry using the anti-LYVE1 antibody. Two representative cases are shown. Statistical significance was assessed by χ2 test. Scale bars: 50 μm (D and E). **P < 0.01.

