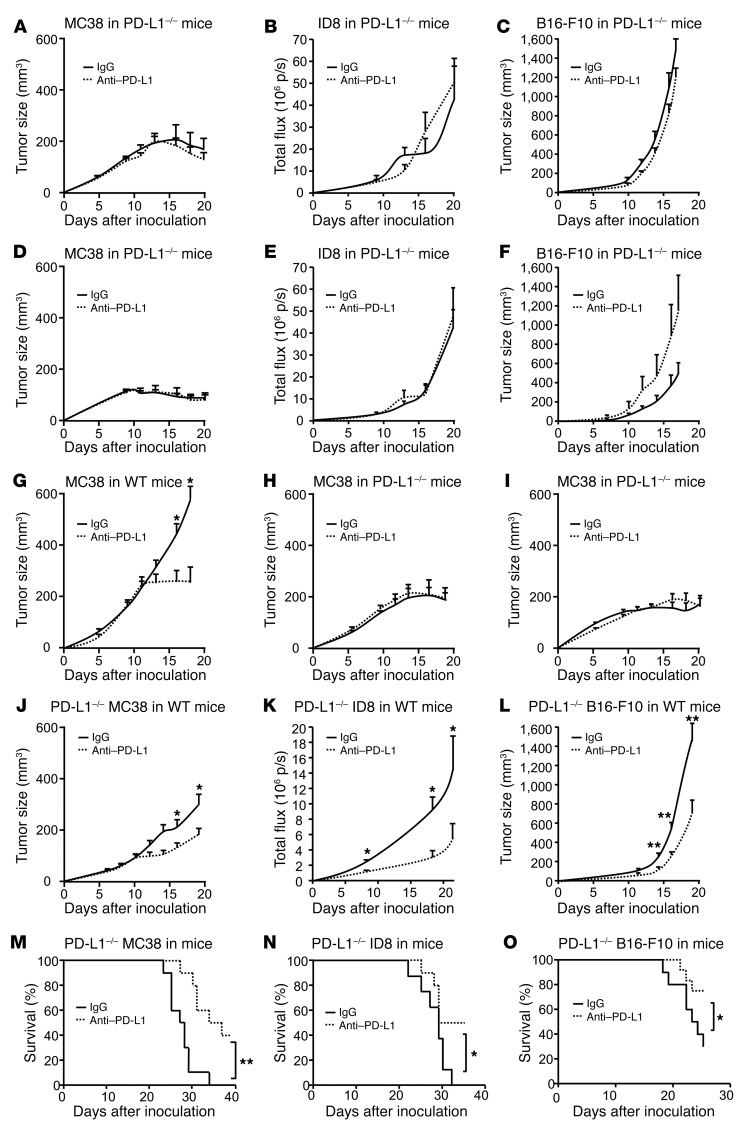
Figure 2. Effect of anti–PD-L1 and anti–PD-1 on tumor volume in tumor-bearing mice.
(A–F) PD-L1–/– and PD-1–/– mice were inoculated with MC38, ID8, and B16-F10 tumor cells and treated with anti–PD-L1 or isotype control (rIgG1). Tumor volume was monitored. (G–I) WT, PD-L1–/–, and PD-1–/– mice were inoculated with MC38 tumor cells and treated with anti–PD-1 or isotype control. Tumor volume was monitored. (J–O) PD-L1–/– MC38, ID8, and B16-F10 tumor cells were inoculated into WT mice. Mice were treated with anti–PD-L1 or isotype control. Tumor volume and mouse survival were monitored. A–F, n= 5–7; G–I, n= 7–9; J–L, n = 10–20; M–O, n = 8–10. Wilcoxon test was used for 2-way comparisons. Kaplan-Meier method was used for analyzing survival. *P < 0.05; **P < 0.01.

