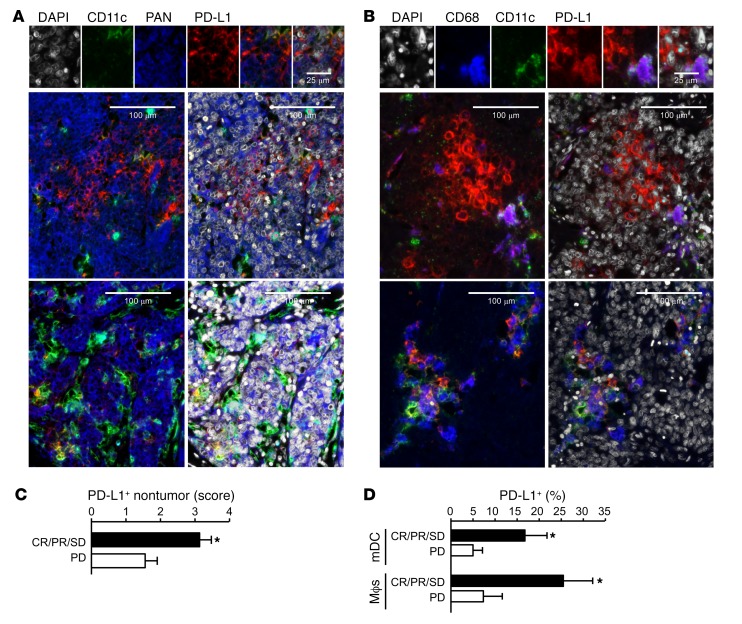
Figure 6. Relationship between PD-L1+ APCs and clinical response to PD-1 blockade in patients with ovarian carcinoma.
(A–D) Multiplexed immunofluorescence analysis of PD-L1 expression in ovarian cancer tissues. (A and B) Representative images of PD-L1 expression (red) in ovarian cancer cells (PAN-keratin) and APC subsets in ovarian cancer tissues. (C) PD-L1 expression score was quantified in nontumor cells in patients with clinical responses (complete response, partial response, and stable disease) and progressive disease. *P < 0.05. (D) Percentages of PD-L1 expression were quantified in mDCs and macrophages in ovarian cancer patients with clinical responses (complete response, partial response, and stable disease) and progressive disease. *P < 0.05.

