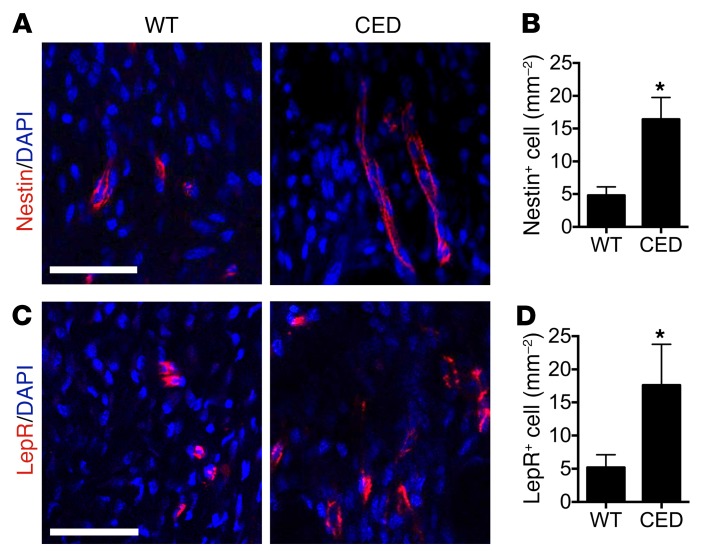
Figure 5. Nestin+ and LepR+ progenitor cells are increased in HO in CED mice.
(A and C) Immunostaining and (B and D) quantitative analysis of (A and B) Nestin+ (red) cells and (C and D) LepR+ cells in the PCT bone marrow 4 weeks after sham and SMTS operations. Scale bars: 30 μm. Data shown as mean ± SEM. n = 10. *P < 0.05 compared between groups.

