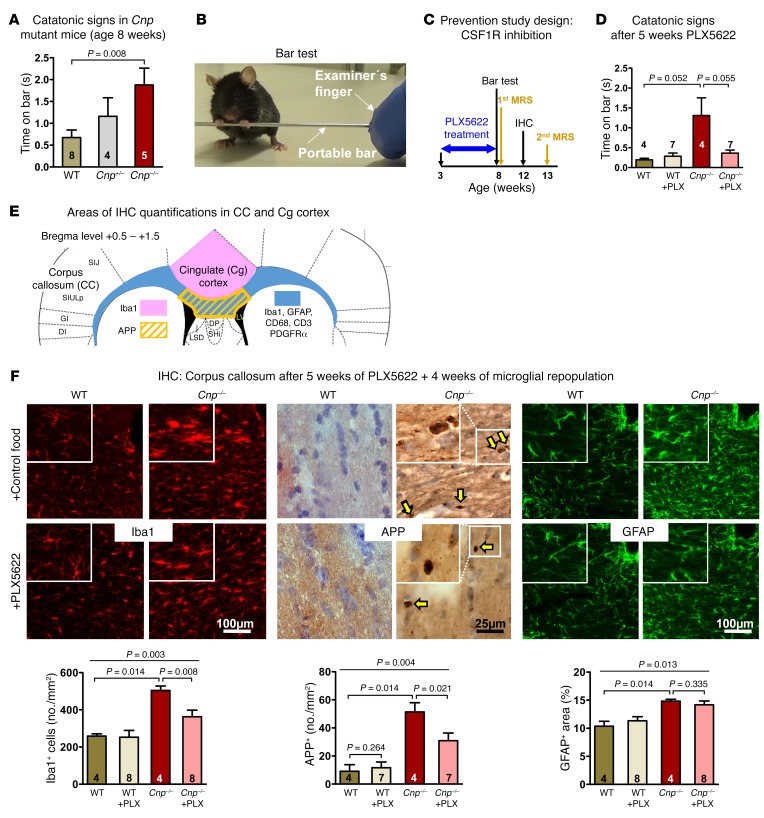
Figure 2. Early catatonia and white matter inflammation in Cnp mutant mice and their prevention by CSF1R inhibition.
(A) Catatonic signs measured by the bar test in WT, Cnp+/–, and Cnp–/– mice at the age of 8 weeks (Kruskal-Wallis, P = 0.034). (B) Image illustrating a mouse with typical catatonic posture during the bar test. (C) Schematic overview of the prevention study design, including PLX5622 (versus regular food) feeding phase (blue arrow) and time points of testing/analyses. Black arrows: bar test (results in Figure 2D) and IHC (results in Figure 2F); yellow arrows: MRS measurements (results in Figure 3). (D) Catatonic signs in WT and Cnp–/– mice (age 8 weeks) after 5-week PLX5622 or control food diet (Kruskal-Wallis, P = 0.165). (E) Schematic overview illustrating corpus callosum and neighboring cingulate cortex areas for IHC quantifications: defined ROI for quantifying APP+ swellings, Iba1+ and CD3+ cells as well as GFAP+ and CD68+ areas (densitometric analysis) shown by the yellow striped field and the blue area, respectively; cingulate area (Cg1/Cg2) for Iba1+ cell quantification displayed in rose. (F) IHC quantification within the corpus callosum of WT or Cnp–/– mice (age 12 weeks) at 4 weeks of microglia repopulation after 5 weeks of PLX5622 or control diet, as shown in C and E. Upper panels show representative images, including higher-magnification inserts, of the quantifications shown underneath: Iba1+ cells (no./mm2; 1 section/brain), APP+ swellings (yellow arrows indicating APP+ spheroids; no./mm2; 3 sections/brain), and densitometric analysis of GFAP+ area (%; 1 section/brain). Original magnification (insets), ×2 (Iba1, GFAP); ×4 (APP). All data in A, D, and F were individually tested for Gaussian distribution using the Kolmogorov-Smirnov test. Nonparametric Kruskal-Wallis test was performed for A, D and F for multiple group comparisons, followed by post hoc 1-tailed Mann-Whitney U test. All data are shown as mean ± SEM; n indicated within bars.

