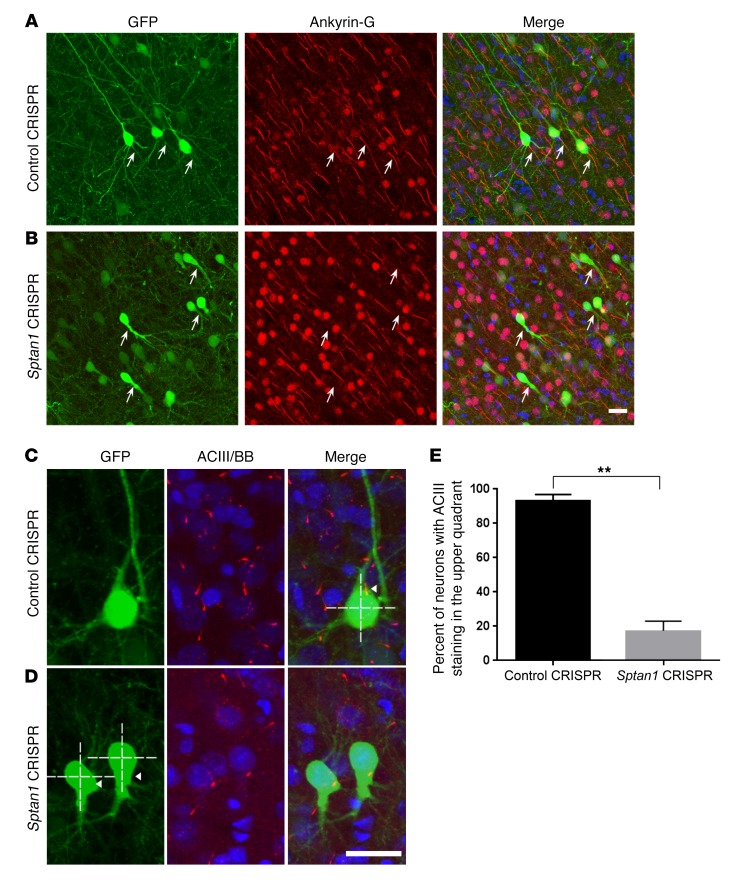
Figure 4. Sptan1 deletion disrupts AIS formation and neuronal polarity in vivo.
(A) Confocal images from a P21 control after prior transfection at E14–15 showing GFP+ cortical neurons (green) with typical pyramidal morphology and ankyrin-G immunolabeling (red) of their proximal axon (arrows). (B) In contrast, Sptan1 CRISPR–transfected cells lack ankyrin-G staining. (C and D) Adenylyl cyclase III (ACIII, red), a marker for primary neuronal cilia, is seen in the typical apical location of a control GFP-labeled neuron (C, arrowhead) but is mislocalized (D, arrowheads) to the basal pole in GFP+ neurons after αII spectrin deletion, indicating disrupted neuronal polarity. Blue is bisbenzimide (BB) nuclear stain. Scale bars: 10 μm in B (for A and B), 10 μm in D (for C and D). (E) Quantification of the percentages of cells with ACIII staining in the upper quadrants of the soma in control (92.9%) and Sptan1 CRISPR groups (22.0%). n = 42 neurons from 4 brains with Sptan1 CRIPSR A transfection, n = 39 from 3 brains with control CRISPR transfection. The percentage data are transformed to arcsine value for statistical analysis with a 1-tailed t test; **P < 0.01.

