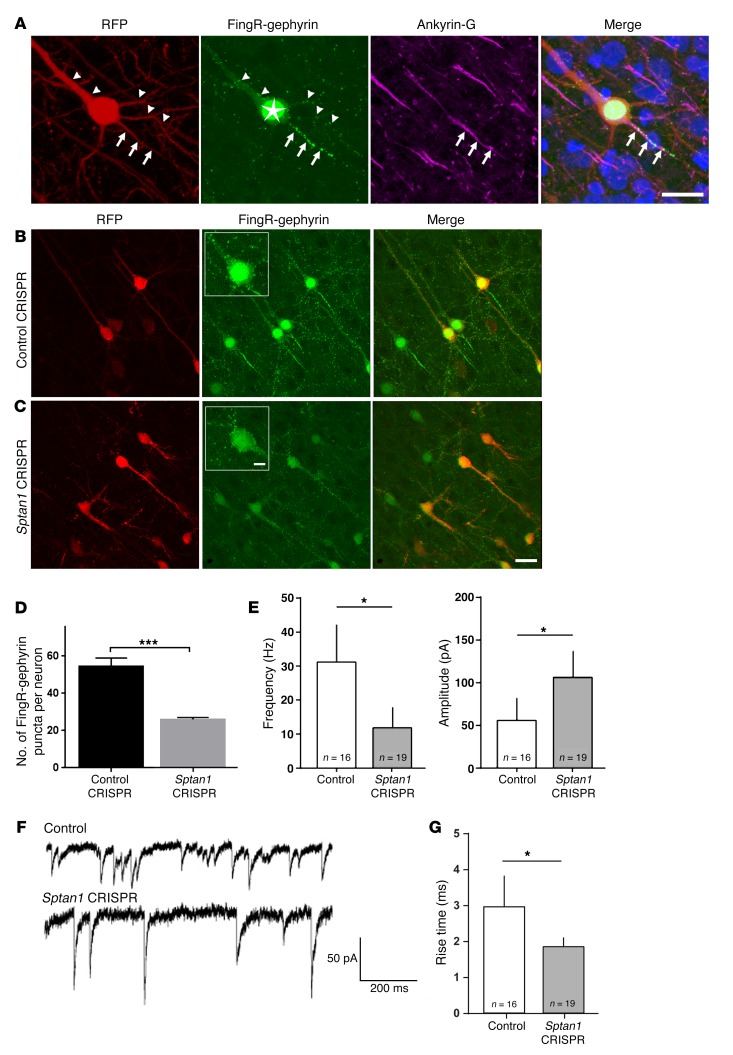
Figure 5. Loss of αII spectrin alters inhibitory innervation.
(A) Confocal image of a neuron in P21 rat cortex that displays typical pyramidal cell morphology after co-electroporation of gephyrin-FingR-GFP (green) and RFP (red) by IUE at E13–14. Arrows indicate the AIS where GFP+ puncta (green) and ankyrin-G (purple) cluster and colocalize; arrowheads indicate punctate GFP labeling along the dendrites. The star indicates excess nuclear gephyrin-FingR-GFP, caused by saturation of endogenous gephyrin binding that leads to a feedback mechanism within the FingR system. Bisbenzimide nuclear stain in blue. (B) Neurons cotransfected with control CRISPR, RFP, and gephyrin-FingR-GFP show abundant GFP+ puncta along axonal and somatodendritic domains. (C) Sptan1 CRISPR/Cas9–transfected neurons, in contrast, show dramatically decreased GFP+ puncta. Insets in middle panels of B and C are higher-magnification images. Scale bars: 10 μm in A, 10 μm in C (for B and C), 5 μm in C inset for insets in B and C. (D) Quantification of GFP+ puncta density on proximal somatodendritic domains and axons (AIS excluded) shows a 45.8% reduction in Sptan1-deleted neurons. One-tailed t test. (E) Frequency (left) and amplitude (right) of miniature inhibitory postsynaptic currents (mIPSCs) are altered in the Sptan1-deleted neurons. Two-tailed t test. (F) Examples of voltage-clamp mIPSC recordings from control (upper trace) and Sptan1-deleted (lower trace) neurons. (G) mIPSC rise times for GFP+ cells from control and Sptan1 CRISPR–transfected cells. The mean rise time is significantly shorter for Sptan1 CRISPR cells. Two-tailed t test performed in G. One-tailed t test: *P < 0.05; ***P < 0.001. In FingR-gephyrin experiments, n = 21 neurons (3 brains) with Sptan1 CRISPR A transfection and n = 19 neurons (3 brains) with control CRISPR transfection were analyzed. In patch-clamp experiments, n = 19 Sptan1-deleted and n = 16 control neurons (from ≥3 brains and 3 neurons per brain per condition) were analyzed.

