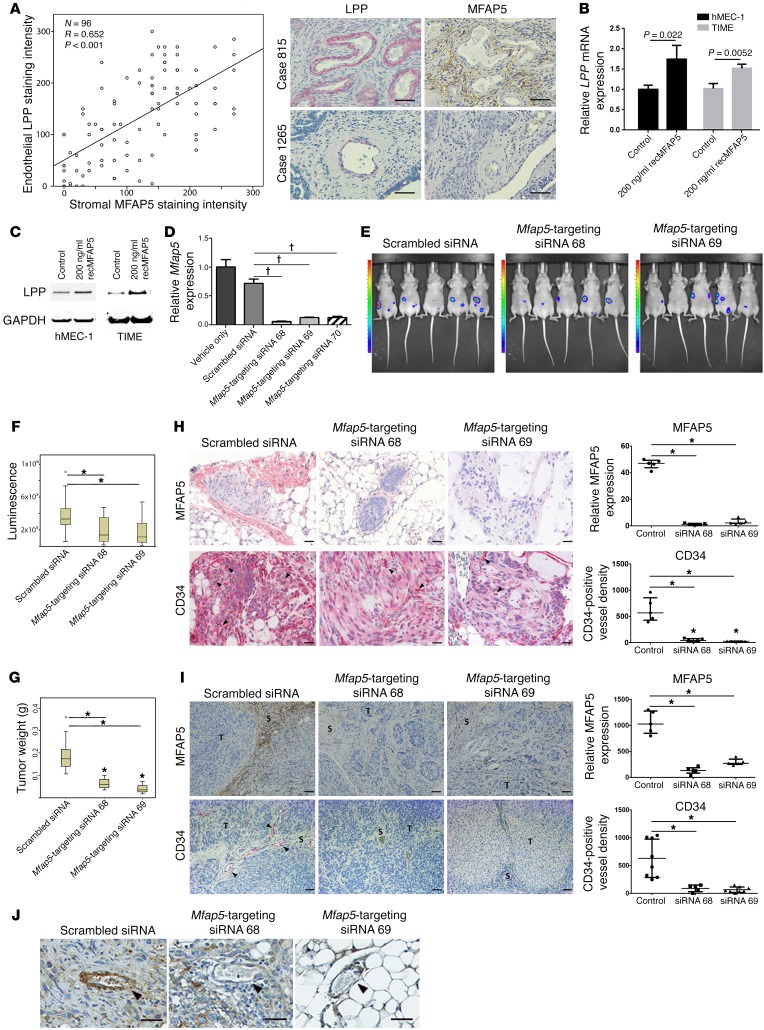
Figure 3. CAF-derived MFAP5 modulates endothelial LPP expression and tumor vasculature.
(A) Plot shows a significant correlation between LPP expression in endothelial cells and MFAP5 expression in CAFs (n = 96; R = 0.652, P < 0.001, by Spearman rank correlation). Hematoxylin-counterstained images of immunolocalization of MFAP5 and LPP in 2 HGSC tissue samples showing that high levels of endothelial LPP expression were associated with high levels of stromal MFAP5 (Case 815) and that low levels of endothelial LPP expression were associated with low levels of stromal MFAP5 (Case 1265). Scale bars: 50 μm. (B) qRT-PCR analyses show that TIME and hMEC-1 MECs treated with recMFAP5 had significantly higher levels of LPP mRNA than did PBS-treated MECs (mean ± SEM of 3 independent experiments; P values were determined by 2-tailed Student’s t test). (C) Western blots show that TIME and hMEC-1 MECs treated with recMFAP5 had markedly increased LPP protein expression levels compared with PBS-treated MECs. (D) Murine fibroblasts transfected with 3 different Mfap5-specific siRNAs had significantly lower levels of Mfap5 mRNA expression than did those transfected with the scrambled siRNA or the vehicle (mean ± SEM of 3 independent experiments; †P < 0.001, by 2-tailed Student’s t test). (E) Bioluminescence images showing markedly decreased luciferase signals in A224 ovarian tumor–bearing mice treated with chitosan nanoparticles incorporated with Mfap5-targeting siRNAs compared with mice injected with chitosan nanoparticles incorporated with the scrambled siRNA. Tumor growth was monitored using the IVIS 200 Bioluminescence and Fluorescence Imaging System. (F) Box and whisker plot showing significantly lower luminescence signal intensities in mice treated with chitosan nanoparticles incorporated with Mfap5-targeting siRNA 68 and Mfap5-targeting siRNA 69 than signals in mice injected with chitosan nanoparticles incorporated with the scrambled siRNA. Boxes represent the interquartile range of the records, and the lines across the boxes indicate the median. Whiskers indicate the highest and lowest values that were no greater than 1.5 times the interquartile range (n = 10 per group; *P < 0.01, by Mann-Whitney U test). (G) Box and whisker plot showing that the tumor weights in mice treated with Mfap5-targeting siRNA were significantly lower than tumor weightsin mice treated with scrambled siRNA at the experimental endpoint (n = 10/group; *P < 0.01, by Mann-Whitney U test). (H) Hematoxylin-counterstained images of immunolocalization of murine Mfap5 and CD34 show that tumors from Mfap5-targeting siRNA– treated mice had markedly lower stromal Mfap5 expression and lower CD34-positive microvessel densities than did tumors from control mice (n = 5 per group; mean ± SD; *P < 0.01, by Mann-Whitney U test). Tumor cells were injected i.p. Scale bars: 50 μm. (I) Hematoxylin-counterstained images of immunolocalization of murine Mfap5 and CD34 show that tumors from Mfap5-targeting siRNA– treated mice had markedly lower stromal Mfap5 expression and lower CD34-positive microvessel densities than did tumors from control mice (n = 5 per group; mean ± SD; *P < 0.01, by Mann-Whitney U test). Tumor cells were delivered by intraovarian injection. Scale bars: 50 μm. S, Stroma; T, Tumor. (J) Hematoxylin-counterstained images of immunolocalization of Lpp show that tumors from mice treated with Mfap5-targeting siRNAs had significantly lower endothelial Lpp expression levels than did those treated with scrambled siRNA. Arrowheads indicate microvessels in the tumor tissue. Scale bars: 50 μm.

