
Figure 5. Depletion of YY1 Disrupts Gene Expression.
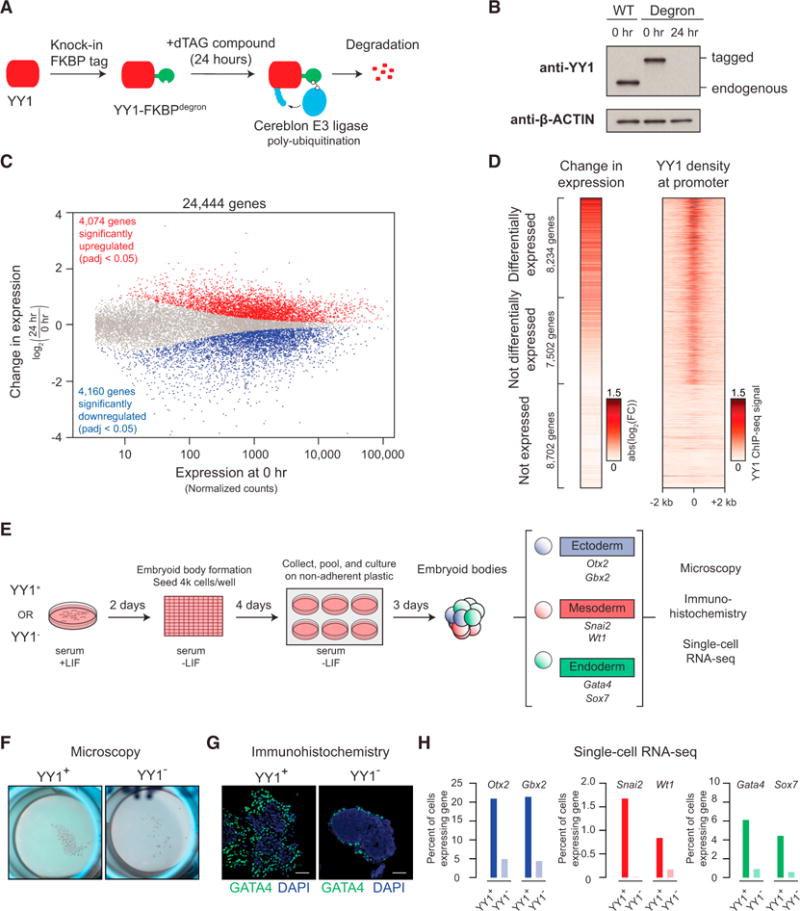
(A) Model depicting dTAG system used to rapidly deplete YY1 protein.
(B) Western blot validation of knockin of FKBP degron tag and ability to inducibly degrade YY1 protein.
(C) Change in gene expression (log2 fold change) upon degradation of YY1 for all genes plotted against the expression in untreated cells. Genes that displayed significant changes in expression (false discovery rate [FDR] adjusted p value <0.05) are colored with upregulated genes plotted in red and downregulated genes plotted in blue.
(D) Heatmaps displaying the change in expression of each gene upon degradation of YY1 and wild-type YY1 ChIP-seq signal in a ±2-kb region centered on the transcription start site (TSS) of each gene. Each row represents a single gene, and genes are ranked by their adjusted p value for change in expression upon YY1 degradation.
(E) Model depicting experimental outline to test the effect of YY1 degradation on embryonic stem cell differentiation into the three germ layers via embryoid body formation from untreated cells (YY1+) and cells treated with dTAG compound to degrade YY1 (YY1−).
(F) Microscopy images of embryoid bodies formed from YY1+ and YY1− cells.
(G) Immunohistochemistry images of embryoid bodies formed from YY1+ and YY1− cells. GATA4 is displayed in green, and DNA stained using DAPI is displayed in blue. The scale bar represents 50 μm.
(H) Quantification of single-cell RNA-seq results for embryoid bodies formed from YY1+ and YY1− cells. The percentage of cells expressing various differentiation-specific genes is displayed for YY1+ and YY1− embryoid bodies.
See also Table S2, Table S3, and Figure S5. See STAR Methods for detailed description of genomics analyses. Datasets used in this figure are listed in Table S4.