
Figure 6. Depletion of YY1 Disrupts Enhancer-Promoter Looping.
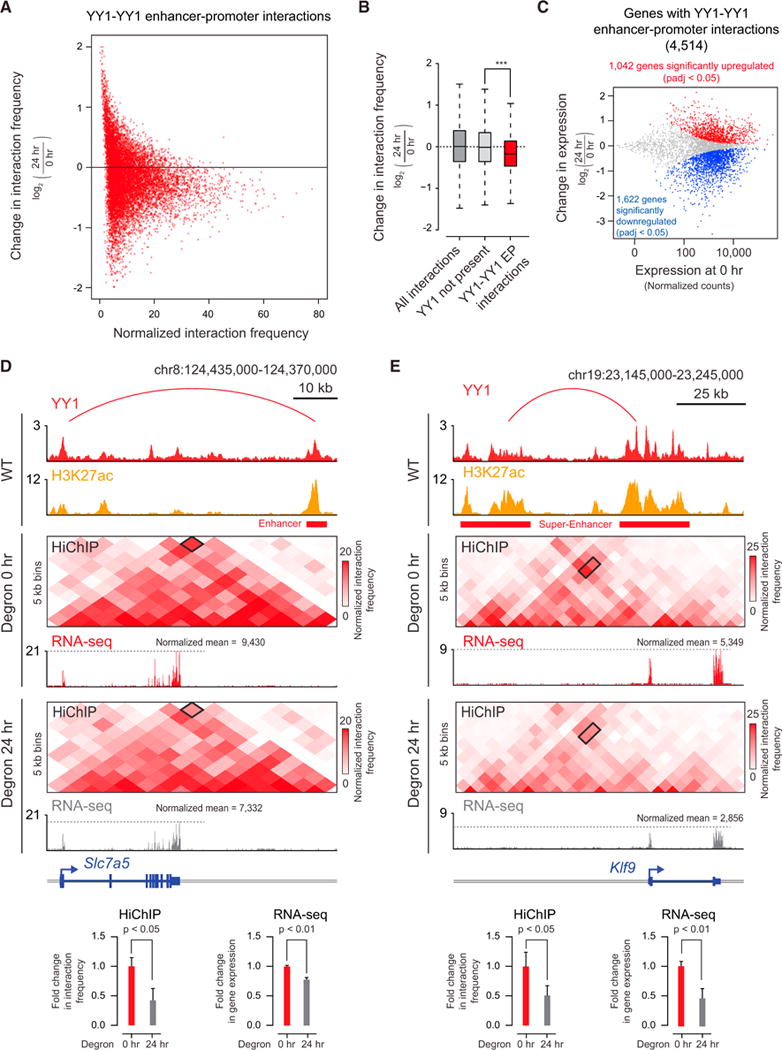
(A) Scatterplot displaying for all YY1-YY1 enhancer-promoter interactions the change in normalized interaction frequency (log2 fold change) upon degradation of YY1, as measured by H3K27ac HiChIP, and plotted against the normalized interaction frequency in untreated cells.
(B) Change in normalized interaction frequency (log2 fold change) upon degradation of YY1 for three different classes of interactions: all interactions, interactions not associated with YY1 ChIP-seq peaks, and YY1-YY1 enhancer-promoter interactions.
(C) Scatterplot displaying for each gene associated with a YY1-YY1 enhancer-promoter interaction the change in gene expression (log2 fold change) upon degradation of YY1 plotted against the expression in untreated cells. Genes that showed significant changes in expression (FDR adjusted p value <0.05) are colored with upregulated genes plotted in red and downregulated genes plotted in blue.
(D and E) Effect of YY1 degradation at the Slc7a5 locus (D) and Klf9 locus (E) on enhancer-promoter interactions and gene expression. The top of each panel shows an arc representing an enhancer-promoter interaction detected in the HiChIP data. Signal in the outlined pixels was used to quantify the change in normalized interaction frequency upon YY1 degradation. Three biological replicates were assayed per condition for H3K27ac HiChIP, and two biological replicates were assayed for RNA-seq. Error bars represent the SD. p values for HiChIP were determined using the Student’s t test. p values for RNA-seq were determined using a Wald test.
See also Figure S6. See STAR Methods for detailed description of genomics analyses. Datasets used in this figure are listed in Table S4.