
Figure 7. Rescue of Enhancer-Promoter Interactions in Cells.
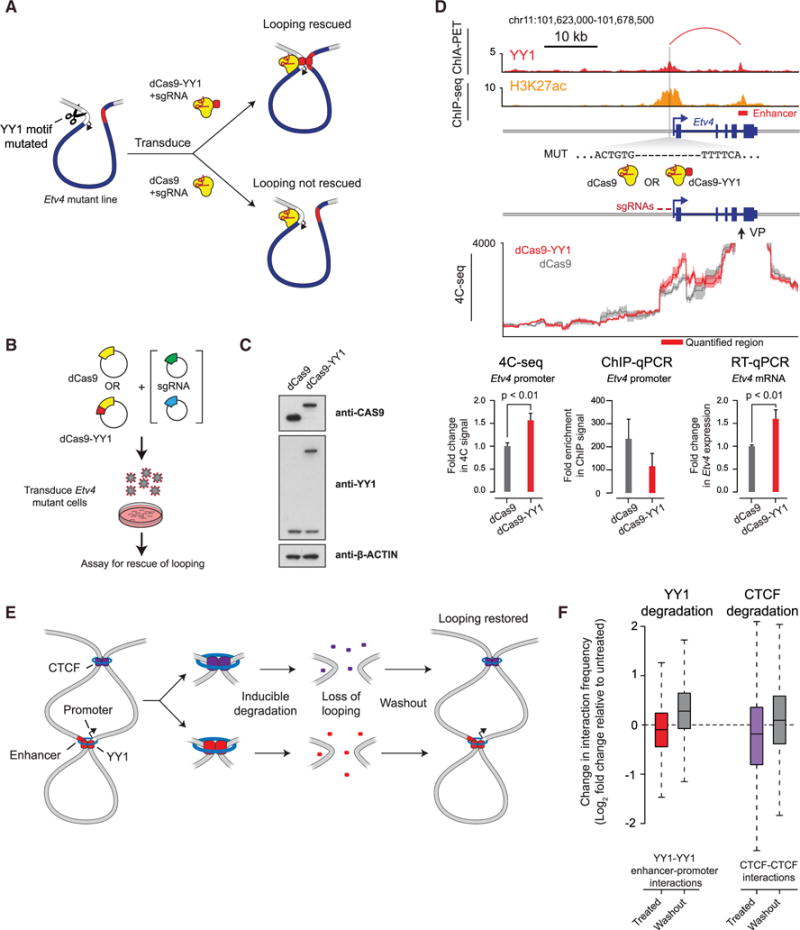
(A) Model depicting use of dCas9-YY1 to artificially tether YY1 to a site adjacent to the YY1 binding site mutation in the promoter-proximal region of Etv4 in order to determine whether artificially tethered YY1 can rescue enhancer-promoter interactions.
(B) Model depicting dCas9-YY1 rescue experiments. Etv4 promoter-proximal YY1 binding motif mutant cells were transduced with lentivirus to stably express either dCas9 or dCas9-YY1, and two sgRNAs to direct their localization to the sequences adjacent to the deleted YY1 binding motif in the Etv4 promoter-proximal region. The ability to rescue enhancer-promoter looping was assayed by 4C-seq.
(C) Western blot results showing that Etv4 promoter-proximal YY1 binding motif mutant cells transduced with lentivirus to stably express either dCas9 or dCas9-YY1 successfully express dCas9 or dCas9-YY1.
(D) Artificial tethering of YY1 using dCas9-YY1 was performed at sites adjacent to the YY1 binding site mutation in the promoter-proximal region of Etv4. The effects of tethering YY1 using dCas9-YY1 on enhancer-promoter looping and expression of the Etv4 gene were measured and compared to dCas9 alone. The genotype of the Etv4 promoter-proximal YY1 binding motif mutant cells and the 4C-seq viewpoint (VP) is shown. The 4C-seq signal is displayed as the smoothed average reads per million per base pair. The mean 4C-seq signal is represented as a line, and the shaded area represents the 95% confidence interval. Three biological replicates were assayed for 4C-seq and CAS9 ChIP-qPCR experiments, and six biological replicates were assayed for RT-qPCR experiments. Error bars represent the SD. All p values were determined using the Student’s t test.
(E) Model depicting the loss of looping interactions after the inducible degradation of the structuring factors CTCF and YY1 followed by restoration of looping upon washout of degradation compounds.
(F) Change in normalized interaction frequency (log2 fold change) after YY1 and CTCF degradation (treated) and recovery (washout) relative to untreated cells. For YY1 degradation, change in normalized interaction frequency is plotted for YY1-YY1 enhancer-promoter interactions. For CTCF degradation, change in normalized interaction frequency is plotted for CTCF-CTCF interactions.
See also Figure S7. See STAR Methods for detailed description of genomics analyses. Datasets used in this figure are listed in Table S4.