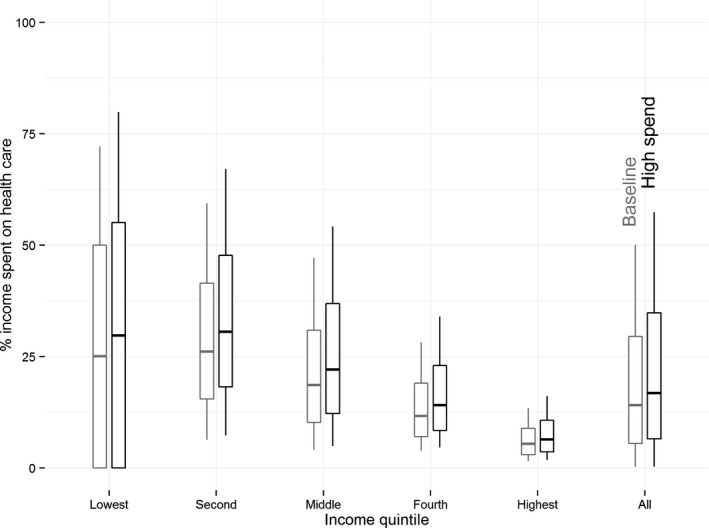
Figure 5.

Distribution of Health Care Spending under Different Growth Scenarios
Note. Boxplots show the distribution of health care spending (as a fraction of income) in the simulated population in 2035. Results are shown separately for each quintile of the income distribution and for the whole population. These results come from the baseline simulation scenario (light) and the high spending growth scenario (dark). The boxes extend from the 25th to 75th percentiles (with a bar at the median), and lines extend from the 10th to 90th percentiles.
