
Figure 4.
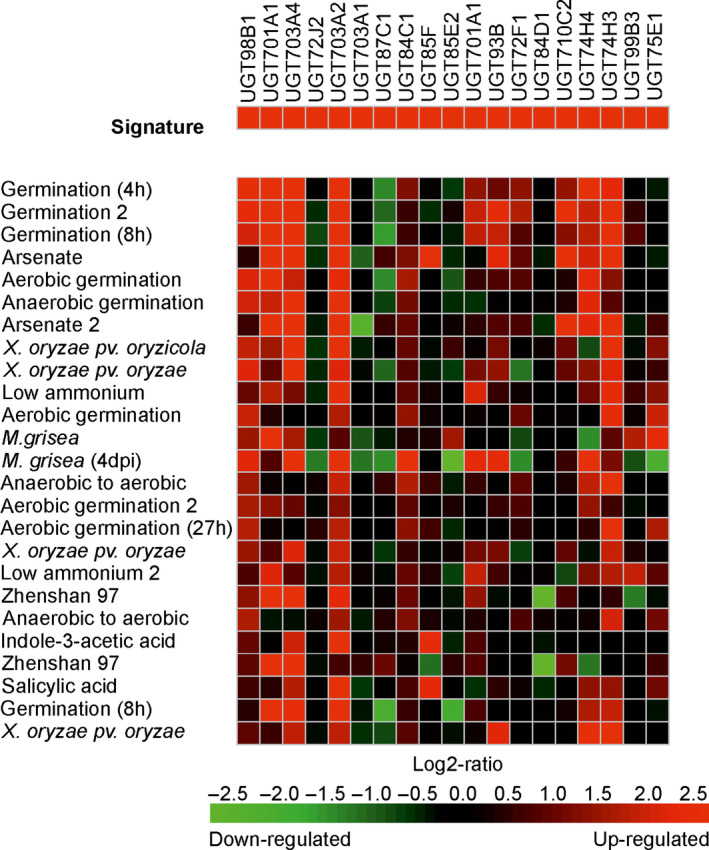
Heat map showing the top 25 conditions as identified by Genevestigator which perturb rice UGTs in a similar manner to that determined following treatment with the herbicide safener fenclorim. Red indicates up‐regulation, black no change and green down‐regulation with the colour intensity reflecting the Log2 perturbation.