Figure 2.

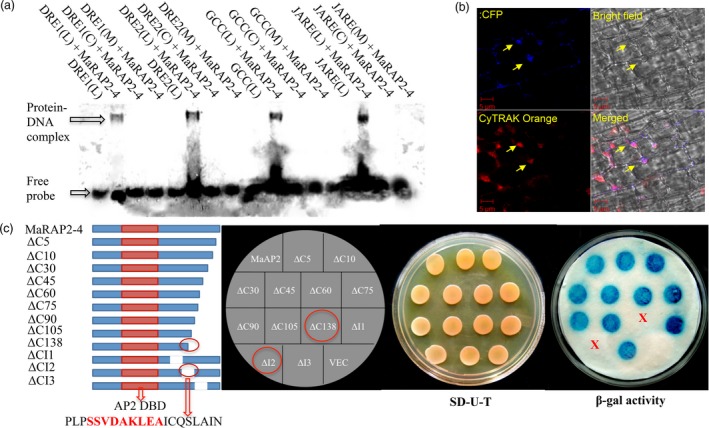
DNA binding property and transactivation domain mapping of MaRAP2‐4. (a) EMSA of MaRAP2‐4 with DRE1/2, JARE and GCC box showed positive interaction (L—DIG‐labelled, C—cold/unlabelled, M—mutated/substituted). (b) Nuclear localization of MaRAP2‐4. Left upper image shows MaRAP2‐4‐CFP fluorescence. Left lower image shows CYTRAK Orange fluorescence that stains both nucleus and cytoplasm with differential intensity. Right upper image shows bright field illumination. Left lower image shows the merged view. The arrows indicate nuclear localization of MaRAP2‐4. (c) To map the transactivation domain, nine C’ terminal truncation and three internal deletions are made. Constructs were transformed, spotted and β‐galactosidase assay was performed. No colour formation in the colonies carrying ΔC138 truncation and ΔCI2 deletion confirms the presence of 20 amino acid transactivation domain in that region. Red coloured region within the transactivation domain highlights the nine amino acid transactivation domain predicted by 9aaTAD Prediction Tool (http://www.med.muni.cz/9aaTAD/index.php).
