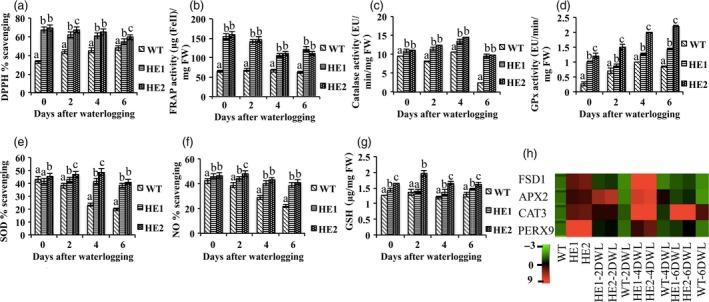
Figure 4.

HE lines showed enhanced antioxidant property after 2, 4 and 6 days of waterlogging stress. (a) DPPH % scavenging showed higher antioxidant activity in HE1 and HE2 than WT. (b) FRAP activity (μg(FeII)/mg FW) was more in HE lines. (c) Catalase activity (μmol/min/mg FW) was more in HE lines. (d) GPx activity (μmol/min/mg FW) was more in HE1 and HE2 than WT. (e) SOD % scavenging was more in HE lines. (f) NO % scavenging showed relatively more decrease in WT. (g) GSH content (μg/mg FW) was also more in HE1 and HE2 than WT. (h) Relative expression of antioxidant‐responsive genes was more in HE1 and HE2 than WT under both control and waterlogging treatment. Represented values were means of 15 independent measurements on a different plant. The error bars show mean ± SD. The letters above column indicates a statistically significant difference for the data of WT plants compared to those of HE lines at different time intervals of waterlogging stress. Different letters indicate a significant difference between columns (P < 0.05), while same letters indicate no significant difference.
