Figure 7.

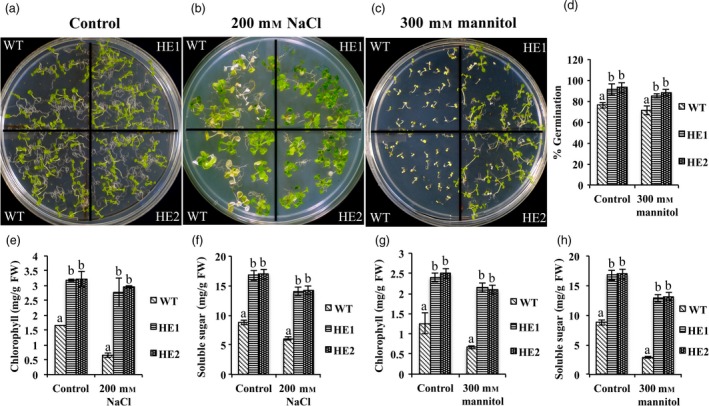
MaRAP2‐4 leads to enhanced drought and salt tolerance. (a) Growth of HE1, HE2 and WT on " MS media. (b) In 200 mm NaCl, WT seedlings showed more senescence and chlorosis than HE lines. (c) In 300 mm mannitol, WT seedlings died just after germination, while HE lines were able to grow. (d) % Germination was also more in HE1 and HE2 than WT under dehydration stress. (e) Chlorophyll content (mg/g FW) was more in HE1 and HE2 than WT under salt stress. (f) Soluble sugars content (mg/g FW) was more in HE1 and HE2 than WT under salt stress. (g) Chlorophyll content (mg/g FW) was more in HE lines under dehydration stress. (h) Soluble sugars content (mg/g FW) was more in HE lines under dehydration stress. Chlorophyll content, sugar content and % germination were calculated based on the mean of three independent experiment performed. The error bars show mean ± SD. The letters above column indicates a statistically significant difference for the data of WT plants compared to those of HE lines under control and stress conditions. Different letters indicate a significant difference between columns (P < 0.05), while same letters indicate no significant difference.
