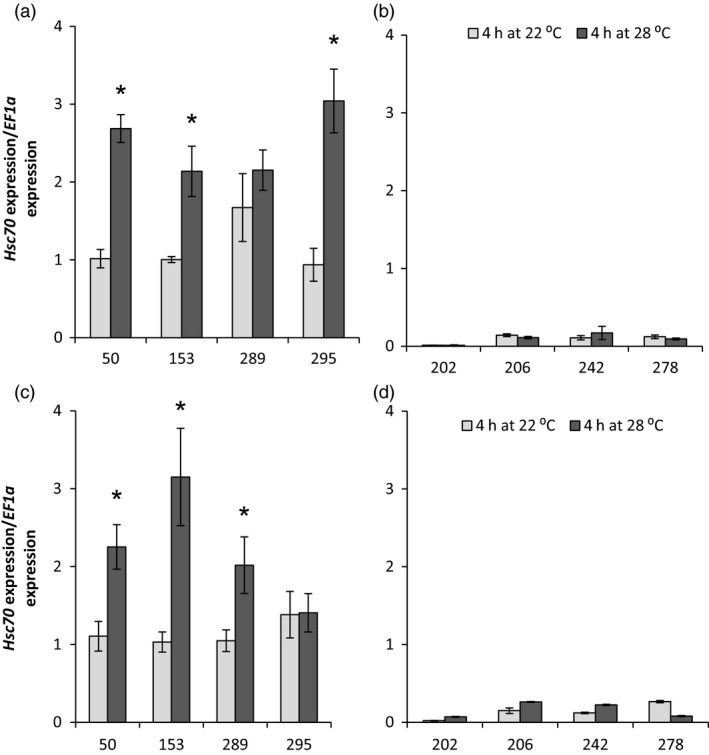
Figure 4.

Relative expression level of HSc70 in 06H1 population. (a) Tubers from A2A3 heat‐tolerant genotypes (genotype number 50, 153, 289 and 295); (b) tubers from A1A4 heat‐sensitive genotypes (genotype number 202, 206, 242 and 278); (c) leaves from A2A3 heat‐tolerant genotypes (genotype number 50, 153, 289 and 295) and; (d) leaves from A1A4 heat sensitive genotypes (genotype number 202, 206, 242 and 278). Asterisk indicates statistical differences between temperatures as determined by Student's t‐test. Error bars represent the standard error of the mean (n = 3) (P < 0.05).
