Figure 6.

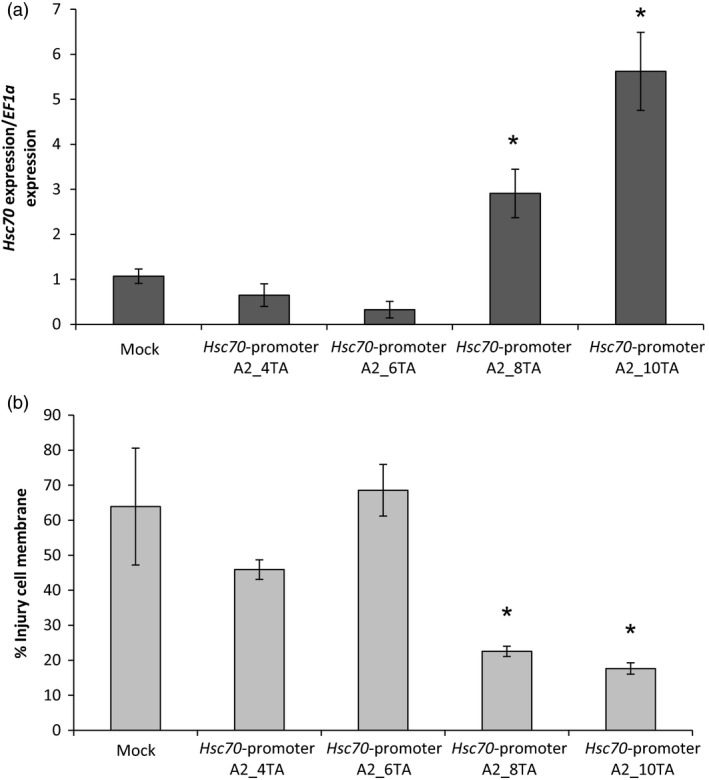
Promoter deletion analysis by agro‐infiltration of Nicotiana benthamiana plants. (a) Relative expression level of HSc70 after 1 day at 42 °C in agro‐infiltrated plants with HSc70 promoter deletion constructs versus agro‐infiltrated plants with empty vector (Mock). (b) Membrane damage in agro‐infiltrated N. benthamiana plants after 1 day at 42 °C by electrolyte leakage assay compared with agro‐infiltrated plants with empty vector (Mock). Asterisks indicate significant difference. Error bars represent the standard error of the mean (n = 3) (P < 0.05).
