
Figure 9.
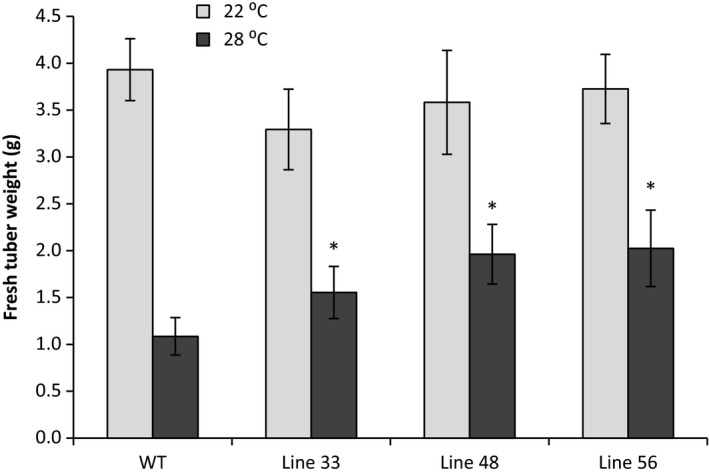
Fresh weight of tubers in A2 HSc70‐expressing lines at 22 and 28 °C. Asterisk indicates statistical difference with wild type at high temperature (Fisher's, P < 0.05). Error bars represent the standard error of the mean (n = 3) (P < 0.05).
Official websites use .gov
A
.gov website belongs to an official
government organization in the United States.
Secure .gov websites use HTTPS
A lock (
) or https:// means you've safely
connected to the .gov website. Share sensitive
information only on official, secure websites.
Fresh weight of tubers in A2 HSc70‐expressing lines at 22 and 28 °C. Asterisk indicates statistical difference with wild type at high temperature (Fisher's, P < 0.05). Error bars represent the standard error of the mean (n = 3) (P < 0.05).