Figure 3.

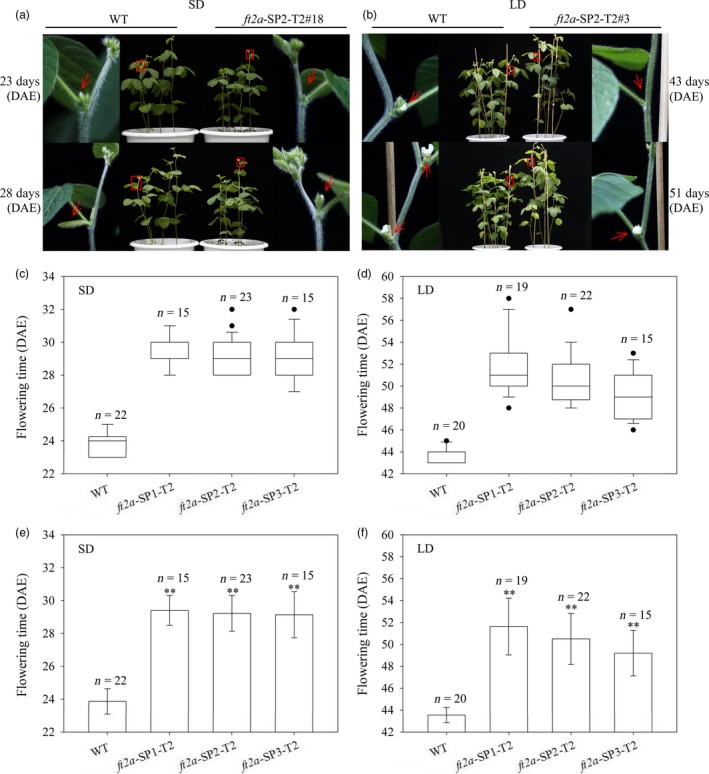
CRISPR/Cas9‐induced ft2a mutants exhibited late flowering in the T2 generation under both long‐day (LD) and short‐day (SD) conditions. (a) and (b) Phenotypes of wild‐type plants (WT, Jack) and homozygous T2 ft2a‐SP2 mutants under SD and LD condition, respectively. Top panel, ft2a‐SP2‐T2#18 and ft2a‐SP2‐T2#3 mutants did not have floral buds when WT plants were flowering. Bottom panel, flowers of WT fell off and produced the pods when ft2a‐SP2‐T2#18 and ft2a‐SP2‐T2#3 mutants were flowering. Red box, magnified view. (c) and (e) Flowering time of WT and homozygous T2 ft2a mutants at three target sites under SD conditions. (d) and (f) Flowering time of WT and homozygous T2 ft2a mutants at three target sites under LD conditions. n, exact numbers of individual plants identified. **, homozygous T2 ft2a mutants exhibit highly significant late flowering (P < 0.01). DAE, days after emergence. The flowering time is shown as the mean values ± standard deviation.
