
Figure 1.
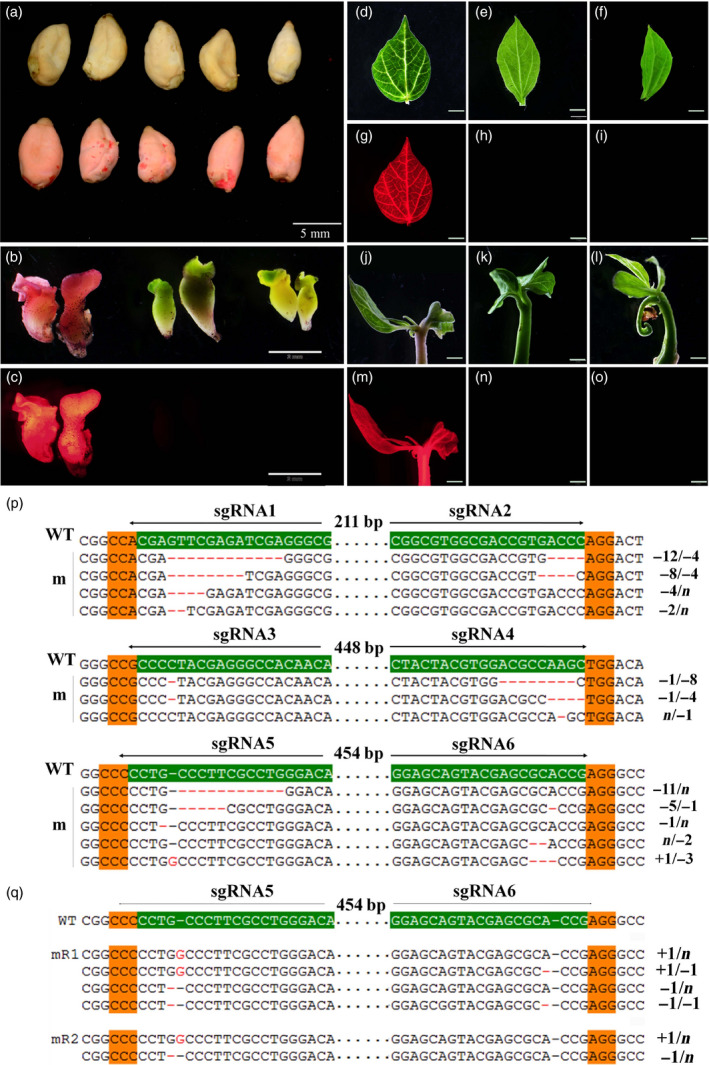
DsRed2 mutation is induced by the CRISPR/Cas9 system. (a) Seeds of wild‐type cotton YZ1 (upper row) and a DsRed2 overexpression line (bottom row). (b) and (c) Regenerated somatic embryos of the control line and two mutants (mR1 and mR2) in the white light field (b) and a red fluorescence field at an excitation wavelength of 530 to 550 nm (c). (d) to (o) Leaves and young seedlings from corresponding plants in (b) were observed in the white light field (d, e, f, j, k, l) and the red fluorescence field (g, h, i, m, n, o). Bar in (a) is 5 mm, in (b) to (o) is 2 mm. Sanger sequencing of somatic embryos (p) and two independent mutants (q) at the DsRed2 target sites are exhibited. The sgRNA target sites are highlighted in green background. PAM regions are highlighted in orange. Nucleotide deletions or insertions are shown in red, with details labelled at right. The gaps between the paired sgRNAs are in dotted line, and their lengths are labelled above. WT, the wild type. m, mutation clones.