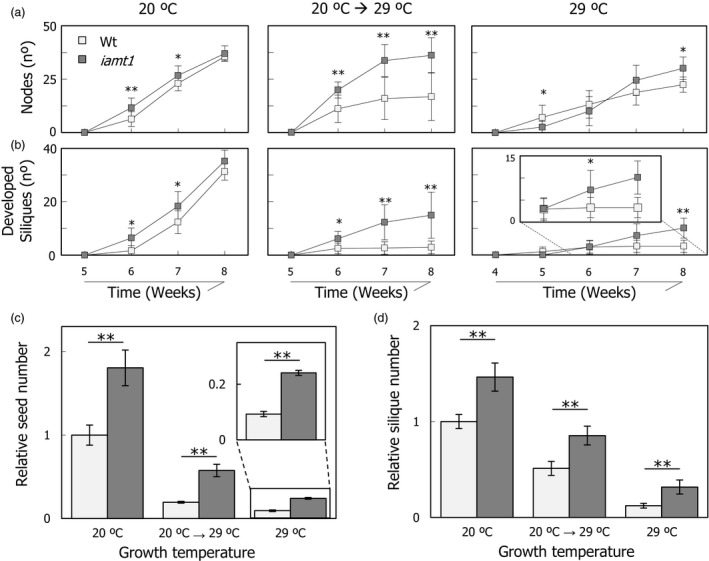
Figure 5.

Total productivity of iamt1 plants. Node (a) and silique (b) formation rates. Relative variation in total number of seeds (c) and siliques (d) produced by wild‐type and iamt1 plants grown at different conditions compared to 20 °C grown wild‐type production. To calculate relative values, total number of seeds (or siliques) was counted from a total of nine plants per genotype and condition as explained in Experimental procedures, the mean values were obtained in each case, and then all values were referred to that of wild type at 20 °C. One and two asterisks indicate P < 0.01 and P < 0.001, respectively (Student's t‐test).
