
Figure 3.
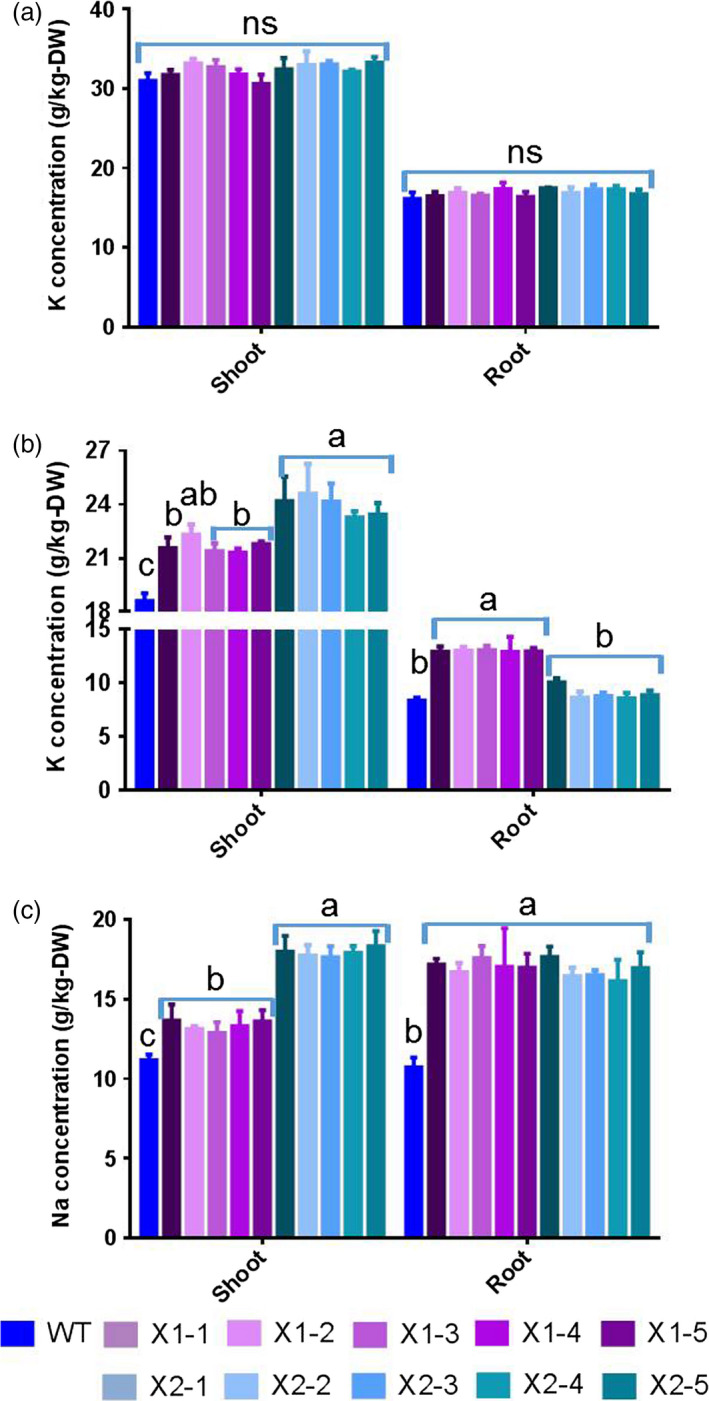
Effects of overexpression of HtNHX1 and HtNHX2 on uptake of K+ and Na+ under full nutrient supply and salt‐stress condition. (a, b) K+ concentration in shoot and root under full nutrient supply and nonsalinized condition (1 mm K+ + 0 mm Na+) (a) and under salinized condition (1 mm K+ + 100 mm Na+) (b); (c) Na+ concentration in shoot and root under salinized condition (1 mm K+ + 100 mm NaCl). WT: cv. Nipponbare; X1‐1, 1‐2, 1‐3, 1‐4 and 1‐5: five T2 individual transgenic lines of expressing HtNHX1; X2‐1, 2‐2, 2‐3, 2‐4 and 2‐5: five T2 individual transgenic lines of expressing HtNHX2. Different letter(s) on the column indicates the significant difference at probability at 5%. ns: no significant difference.