
Figure 2.
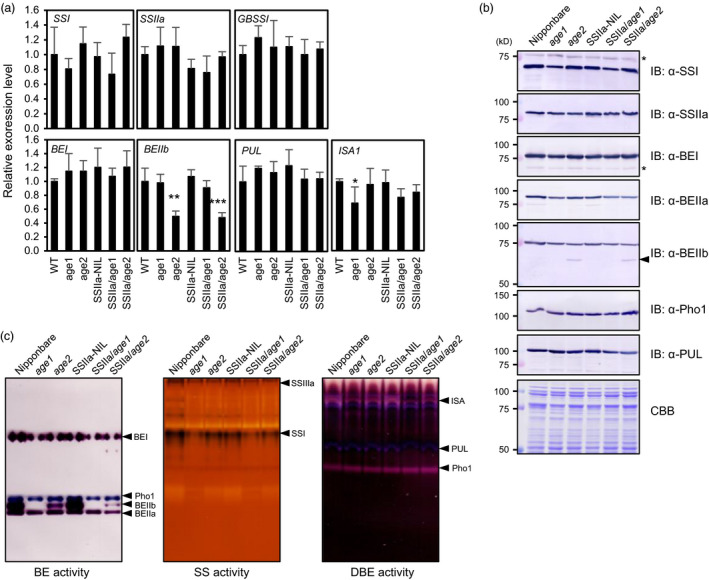
Expression level and enzyme activity of starch biosynthetic enzymes. (a) mRNA levels of starch biosynthetic enzyme genes in developing caryopses were analysed by qRT‐PCR. eEF‐1α was used as an internal control. The value for Nipponbare (WT) was set to 1, and relative values were shown. Asterisks indicate significant difference from background lines (Nipponbare or SSIIa‐NIL) of each line (Student's t test, *P < 0.05, **P < 0.01, ***P < 0.001). (b) Immunoblot (IB) analysis of soluble endosperm extract from developing seeds. Arrowhead on the right indicates bands corresponding to truncated BEIIb. Asterisks indicate nonspecific signals. (c) branching enzyme, starch synthase and debranching enzyme activities in soluble extract of developing endosperm were detected by activity staining after native‐PAGE. Enzymes corresponding to each activity band were indicated on the right in each panel.