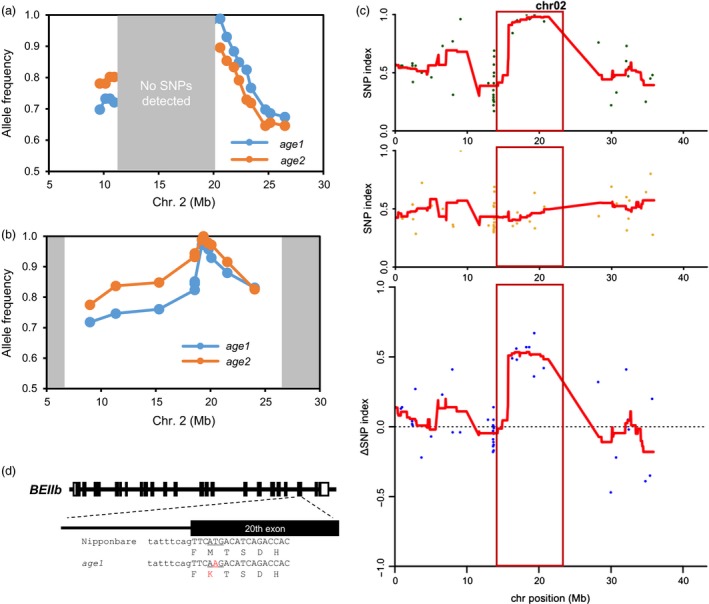
Figure 3.

Genetic mapping of age1. (a) and (b) Nipponbare‐type allele frequency plot of chromosome 2 generated by rough mappings. The results of age mutants‐Koshihikari (a) and age mutants‐SL09 (b) F2 populations are shown. The regions in which no polymorphisms were detected are shaded with grey boxes. (c) SNP index and Δ(SNP index) plots of the chromosome 2 generated by MutMapPlus analysis. SNP index of the mutant (M) bulk (upper panel) and the wild‐type (WT) bulk (middle panel) and Δ(SNP index) calculated by subtraction of the index of WT bulk from that of M bulk (lower panel) is shown. Red lines indicate the sliding window average of 4 Mb intervals with 50 kb increment. Candidate region confined by the Fisher's P value of <0.05 is indicated with a red box. (d) Schematic diagrams of BEIIb gene in age1 allele. Open and black boxes indicate untranslated regions and exons, respectively. Uppercase and lowercase letters indicate DNA sequence of exon and intron, respectively. Translated amino acids are shown under the DNA sequence. Substituted nucleotide and amino acid are shown by red letter.
